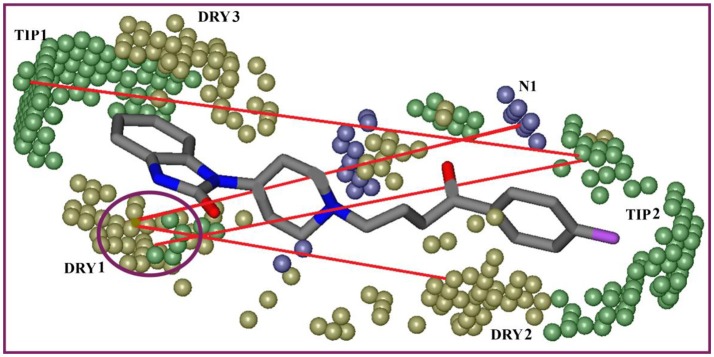
Figure 7.
Shows the most relevant regions identified by GRIND model for ligand-hERG interaction. The contours define the virtual receptor site (VRS). DRY-DRY (yellow contours) representing the mutual distance of 14.0–14.4 A° between two hydrophobic molecular interaction fields (DRY1 and DRY2), TIP-TIP (green contours) feature showing a distance of 20.0–20.4 A° between two steric hotspots (TIP1 and TIP2), DRY-TIP representing a distance of 18.4–18.8 A° between hydrophobic molecular interaction field (DRY1: yellow) and steric hotspot (TIP2: green). DRY-N1 representing hydrophobic molecular interaction field (DRY1: yellow) at a distance of 10.8–11.8 A° from amide nitrogen representing hydrogen bond donor feature (N1: blue contours) that contribute positively to hERG blockage potential (pIC50). Interestingly, the molecular features mapped by DRY-DRY correlogram complement the molecular features translated by the highest peak of DRY-TIP cross-correlogram peaks shown in Figure 6. Both DRY-DRY and DRY-TIP auto and cross-correlograms corresponds to the hydrophobic moieties attached at both sides of the linker region.

