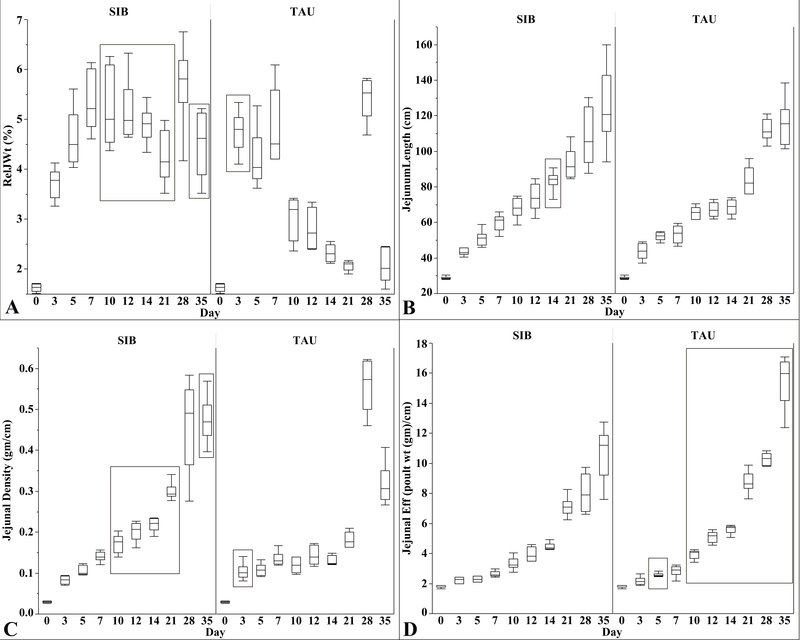
Fig. 2.
Relative jejunal weight (A), jejunal length (B), jejunal density (C), and jejunal efficiency (D) for sampled SIB and TAU poults from day 0 to 35. Box plots show minimum, first quartile, median, third quartile, and maximum values. Significantly different values (p ≤ 0.05) are enclosed in rectangles. (A) Relative jejunal weight was greater in TAU poults at day 3 and greater in SIB poults at days 10 to 35, except for day 28 when the relative jejunal weight was high in TAU poults. (B) Jejunal length was similar in both SIB and TAU poults except for day 14 when the jejunum of SIB poults was significantly longer. (C) At day 3, jejunal density was greater in TAU poults. Jejunal density was significantly greater in SIB poults at days 10 to 35, except for day 28. Median values at day 28 were similar for both SIB and TAU poults. (D) Jejunal efficiency was significantly greater in TAU poults at day 5 and days 10 to 35.

