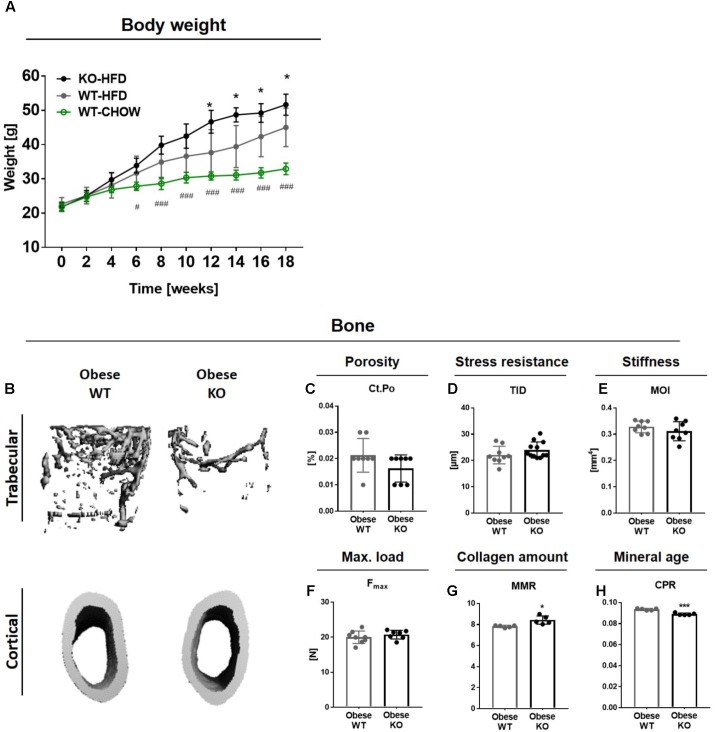
FIGURE 1.
Obese Thy-1−/− mice display decreased trabecular bone mass while cortical bone mass and biomechanical properties are unaltered. Wildtype (WT) and Thy-1−/− (KO) mice were fed with a high fat diet for 18 weeks (HFD). As control group, WT mice were fed a standard chow (CHOW) for the same time period. (A) The body weight of standard and HFD fed WT and KO mice over 18 weeks. Hashtags denote significance level of #P < 0.05, ###P < 0.001 between WT-HFD and WT-CHOW and asterisks denote significance level of ∗P < 0.05 between WT-HFD and KO-HFD (Student’s t-test). (B) Representative 3D-images of the trabecular (upper row) and cortical bone compartment (lower row) of the femur. Bone values are presented in Supplementary Table 2. (C) Cortical porosity (Ct.Po), (D) total indentation distance (TID, reference-point indentation), (E) moment of inertia (MOI, μCT calculation), and (F) maximum force (Fmax, three-point bending test) to fracture cortical bone were examined. (G) Mineral-to-matrix ratio (MMR) and (H) carbonate-to-phosphate ratio were analyzed using fourier-transform infrared spectroscopy (FTIR). Each point represents one mouse and median ± SD is presented. Asterisks denote significance level of ∗P < 0.05, ∗∗∗P < 0.001 (Student’s t-test).

