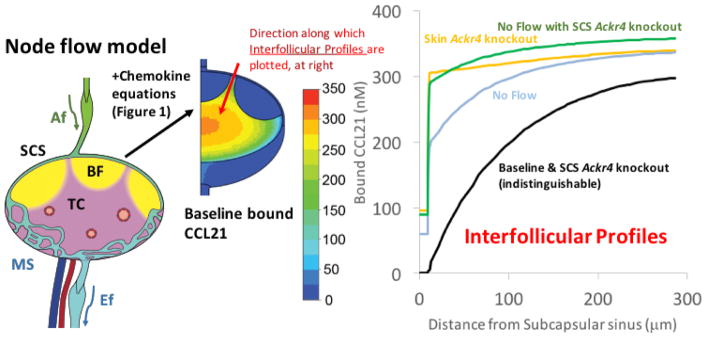
Figure 2. Predicted CCL21 concentrations in skin-draining lymph nodes, and the influence of ACKR4 and/or lymph flow.
The image on the left shows a stylized lymph node showing T cell area (TC, pink), B cell follicles (BF, yellow), afferent lymphatics (Af, green), medullary sinuses (MS, light blue) and efferent lymphatics (Ef, light blue). Mathematical models incorporating multiple physical and biological parameters lead to the baseline CCL21 distribution pattern shown in the middle of the figure. The color key shows the chemokine concentrations. The line graph on the right shows predicted interfollicular CCL21 gradients from the ceiling of the subcapsular sinus (SCS) into the T cell area (along the red arrow shown, 300μm into the T cell area) under the following scenarios: (i) Baseline: Ackr4 and lymph flow intact (black line); (ii) SCS Ackr4 knockout: deletion of Ackr4 from LECs lining the SCS ceiling (identical to baseline so also represented by black line); (iii) Skin Ackr4 knockout: deletion of Ackr4 in the skin (mimicked by inclusion of CCL21 in afferent lymph) (orange line); (iv) No Flow: cessation of lymph flow (light blue line), or (v) No Flow with SCS Ackr4 knockout: no lymph flow plus deletion of Ackr4 from LECs lining the SCS ceiling (green line). Adapted from Jafarnejad et al. [36].

