
Fig.4.
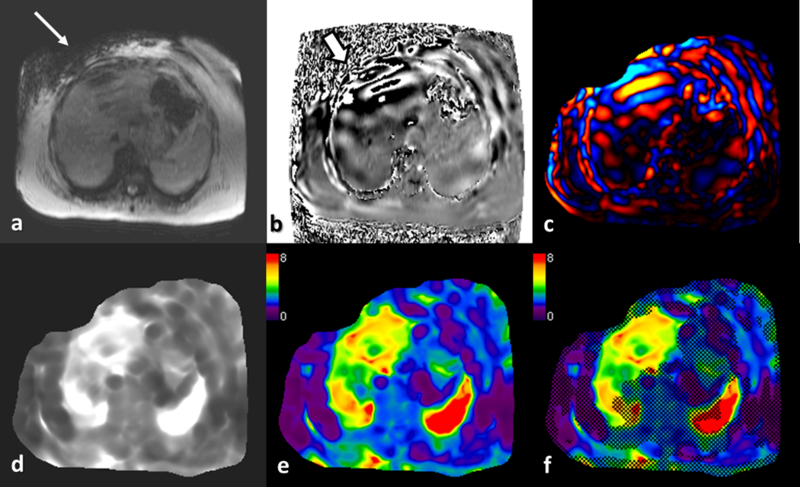
Liver MRE in a patient with NASH. Magnitude image (a) and phase image (b) are available for review immediately after acquisition of a slice. Note the signal loss in right upper quadrant subcutaneous fat (arrow) suggestive of shear waves at the passive driver (not show). Similarly the phase image show high phase shift occurring just below the driver due to intravoxel phase dispersion (white block arrow). Shear waves are seen within the liver, spleen and subcutaneous fat on the phase image. Wave image © showing the shear waves in color. Gray scale (d) and color scale ( e) stiffness maps (elastograms) and color stiffness map with overlayed confidence map (f) are automatically processed within 2 minutes of acquisition.