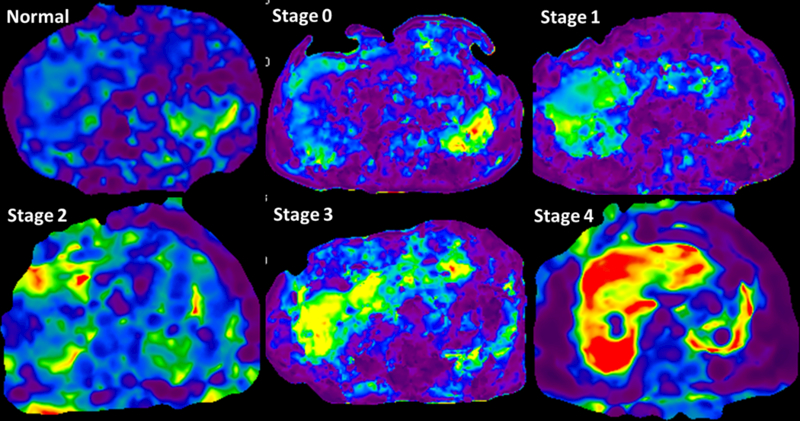
Fig.5.

MRE stiffness maps showing increasing liver stiffness with increasing stages of fibrosis. The change in color from blue-violet in normal volunteer to orange red in stage 4 fibrosis can be readily appreciated. The mean LSM were 1.9kpa in normal, 2.8kPa in stage 0, 3.2kPa in stage 1, 3.6kPa in stage 2, 4.2 in stage 3 and 8.6kPa in stage 4 fibrosis.
