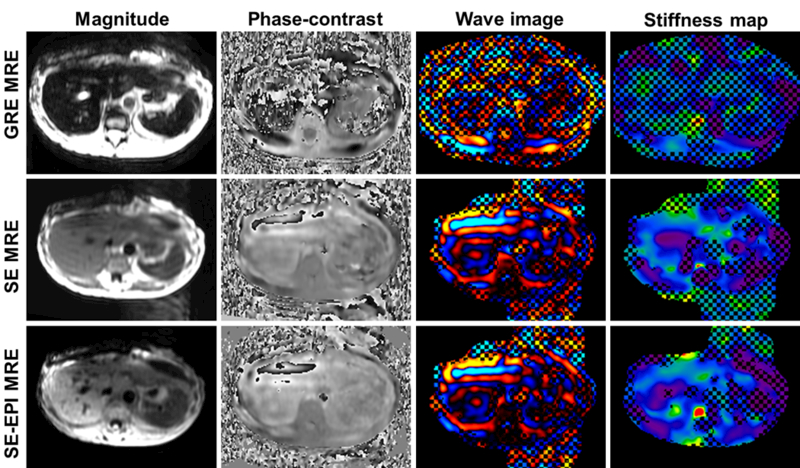
Fig.7.

MRE in a patient with iron overload using the 2D-GRE MRE (top row), SE MRE (middle row) and the SE-EPI MRE techniques (bottom row). Magnitude, phase contrast, wave and stiffness maps from left to right. The low signal level within the liver resulted in noise-dominated phase images for the data obtained with GRE MRE. In contrast, both spin-echo sequences had significantly improved SNR and confidence level. The shear waves can be visualized in the phase-contrast images.The hepatic stiffnesses were 2.3 (±0.83) kPa for SE and 2.4 (±0.77) kPa for SE-EPI while the GRE data was considered a failure.
