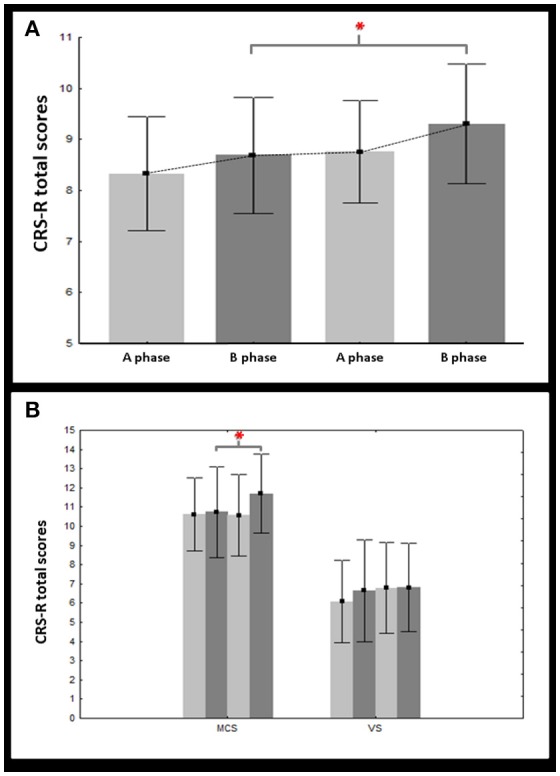
Figure 1.

Changes in CRS-R total scores. This figure illustrates the mean (bars = 95% confidence intervals) of the CRS-R total scores on treatment (dark gray) vs. off treatment (light gray) for both vegetative (VS) and minimally conscious (MCS) groups (A) but also within each group, separately (B). Asterisks indicate significant results (p < 0.05).
