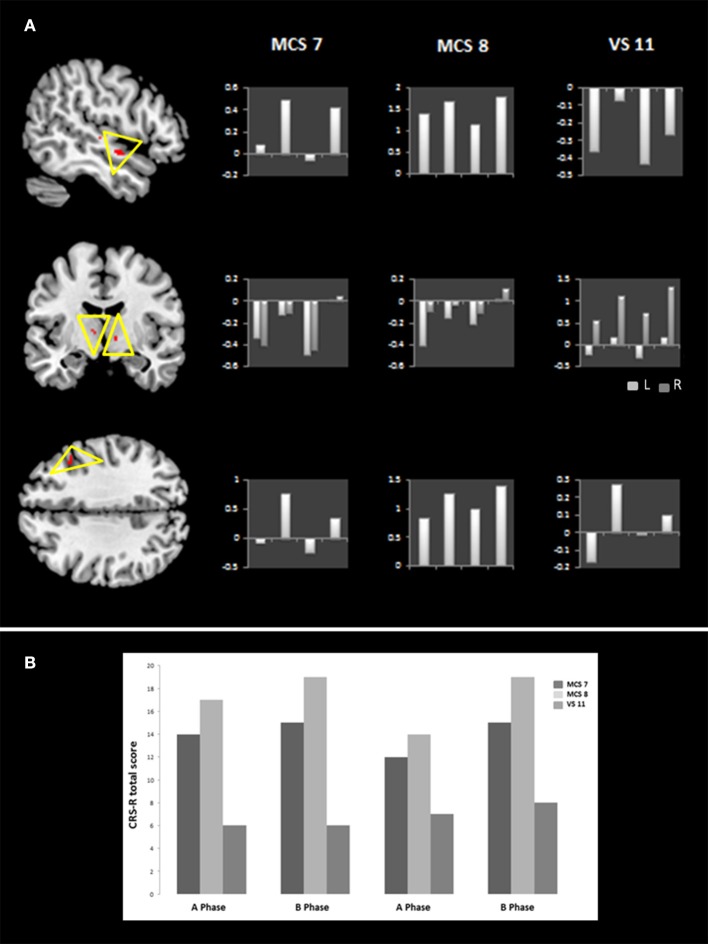
Figure 2.
Brain areas with treatment-related metabolic changes. The left side of (A) illustrates, at the group level, areas with treatment-related metabolic changes which include the right middle frontal gyrus, the right superior temporal gyrus as well as the bilateral ventro-anterior thalamic nucleus (L = left, R = right) (p < 0.005 voxel-wise uncorrected). On the right side of (A), z-scores for each activated area are also reported at each phase (ABAB) for patients MCS 7, MCS 8, and VS 11. (B) Shows the CRS-R total scores on the last week of each phase (ABAB) for patients MCS 7, MCS 8, and VS 11.

