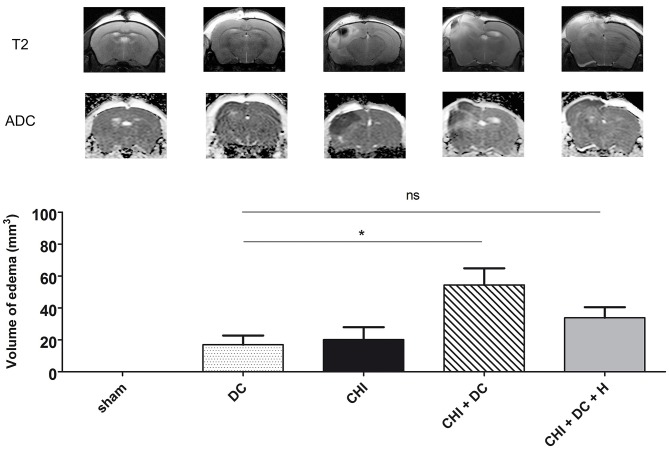
Figure 1.
Demonstrating radiological sequelae (in particular brain edema) of trauma/surgery in experimental groups used for the current analysis. The upper panel displays the representative MRI scans obtained 24 h after trauma/sham treatment using a 9.4 Tesla scanner. There are apparent differences between the groups in pattern of brain edema (with CHI + DC group being most severely affected), as presented on T2-weighted images and on ADC maps. Below, the histogram represents quantitative analysis of ADC maps in regard to volume of brain edema. The volumetric data obtained here were used as one of the variables in correlation analysis in current study (*, p < 0.05; ns, p > 0.05). ADC, apparent diffusion coefficient; CHI, closed head injury; DC, decompressive craniectomy; H, hypothermia; MRI, magnetic resonance imaging. Adapted from Szczygielski et al. (39); © Mary Ann Liebert, Inc., New Rochelle, NY. Adapted with permission.

