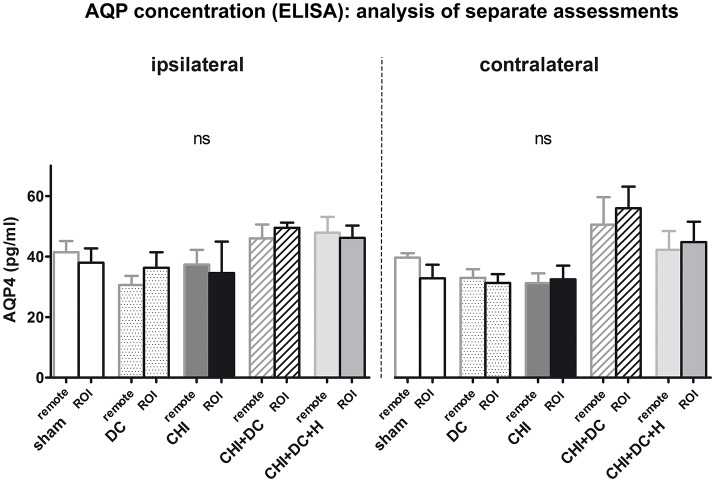
Figure 3.
Histogram showing concentration of AQP4 24 h after trauma/sham injury according to ELISA assessment. The graph represents separate analysis of data i.e., the values are discriminated as to the localization of the sample (ROI vs. remote parts of the brain and ipsi- vs. contralateral hemisphere). Both the response to injury (AQP4 level change) and the differences between single treatment groups seem to be more prominent in contralateral hemisphere (containing more viable tissue), although according to the ANOVA analysis, no statistically significant differences can be registered (ns, p > 0.05 for comparison of groups, matched in distance or laterality in regard to injury epicenter). CHI, closed head injury; DC, decompressive craniectomy; H, hypothermia; ROI, region of interest.

