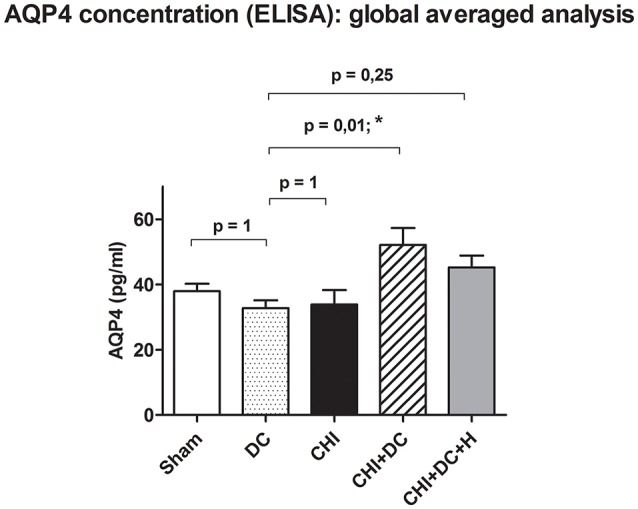
Figure 4.

Histogram showing concentration of AQP4 24 h after trauma/sham injury according to ELISA assessment. The graph represents analysis of global pooled data i.e., the values obtained separately at the level of ROI (ipsi- and contralateral) as well as outside the ROI (ipsi- and contralateral) have been pooled and averaged. According to the ANOVA analysis, the global AQP4 level was significantly higher in the animals subjected to trauma and craniectomy as compared to craniectomy-only group, serving as reference group (CHI+DC vs. DC, p = 0.01, *). This effect vanished, when additional hypothermia has been applied (CHI+DC+H vs. DC, ns, p > 0.05). CHI, closed head injury; DC, decompressive craniectomy; H, hypothermia; ROI, region of interest.
