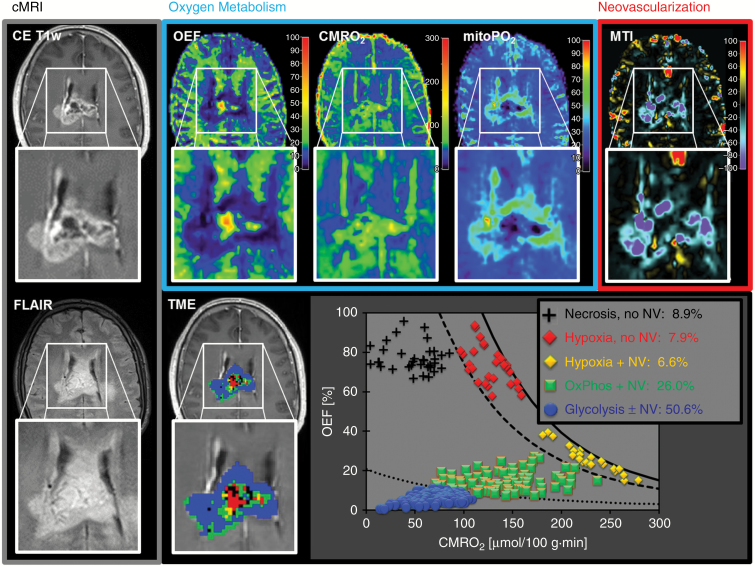
Fig. 1.
Conventional anatomic MRI (cMRI; grey box), oxygen metabolism (OEF, CMRO2, mitoPO2; blue box), neovascularization (MTI; red box), and TME mapping (downright) in a 61-year-old male patient with glioblastoma IDH1wt. Oxygen metabolism and neovascularization demonstrated spatial heterogeneity within the lesion. Information fusion of oxygen metabolism and neovascularization using our TME approach resulted in the CMRO2-OEF scatterplot and finally in the TME map. This glioblastoma was dominated by glycolysis (50.6% of the tumor volume) and functional, stable neovasculature (80.8% of the tumor volume showed neovascularization).

