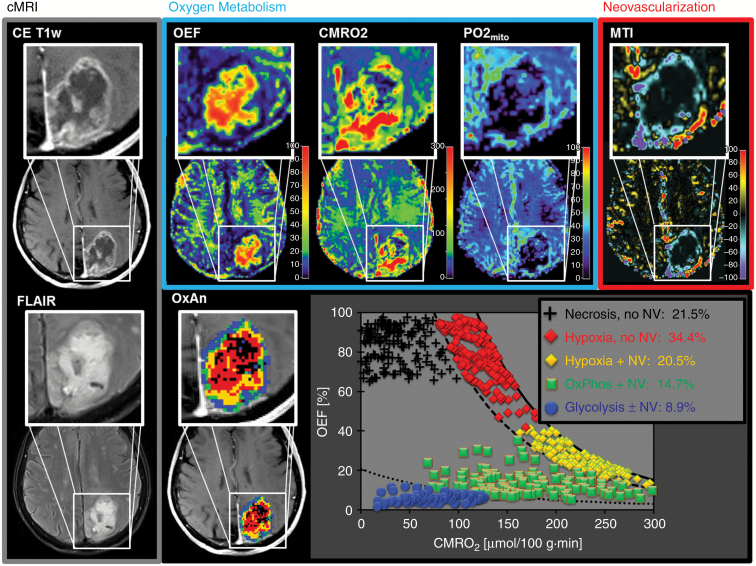
Fig. 2.
Conventional anatomic MRI (cMRI; grey box), oxygen metabolism (OEF, CMRO2, mitoPO2; blue box), neovascularization (MTI; red box), and TME mapping (downright) in a 71-year-old female glioblastoma IDH1wt patient. Spatial heterogeneity of oxygen metabolism and neovascularization in this glioblastoma was similar to that in the patient in Fig. 1. The CMRO2-OEF scatterplot, however, demonstrated a substantially lower percentage of glycolysis and higher percentage of necrosis (21.5%), hypoxia (total 54.9%), and defective tumor vasculature (50.4%).

