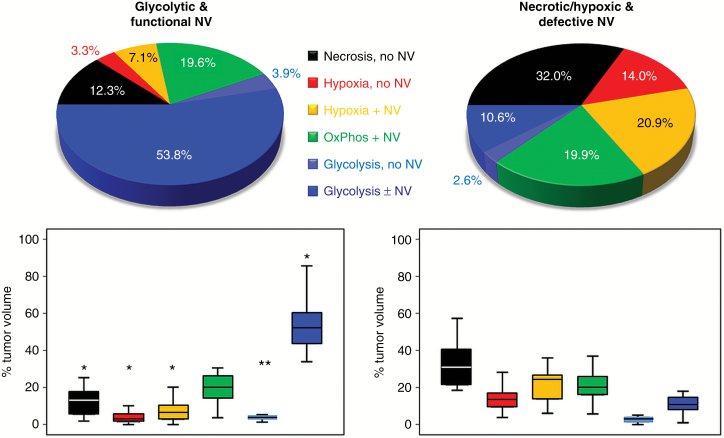
Fig. 3.
Comparison of the 2 metabolic phenotypes of glioblastoma IDH1wt. Upper part: pie charts illustrating the percentage distribution of the TMEs for the glycolytic dominated phenotype with predominantly functional neovasculature (left) and the necrotic/hypoxic dominated phenotype with relatively high percentage of defective tumor neovasculature (right). Lower part: box and whisker plots show the percentage distribution of the TMEs. Boxes are mean ± SD, and whiskers are minimum and maximum values, respectively. Boxes marked with an asterisk (2 asterisks) in the glycolytic phenotype were significantly different from their counterparts in the necrotic/hypoxic phenotype (*P < 0.001; **P = 0.005).

