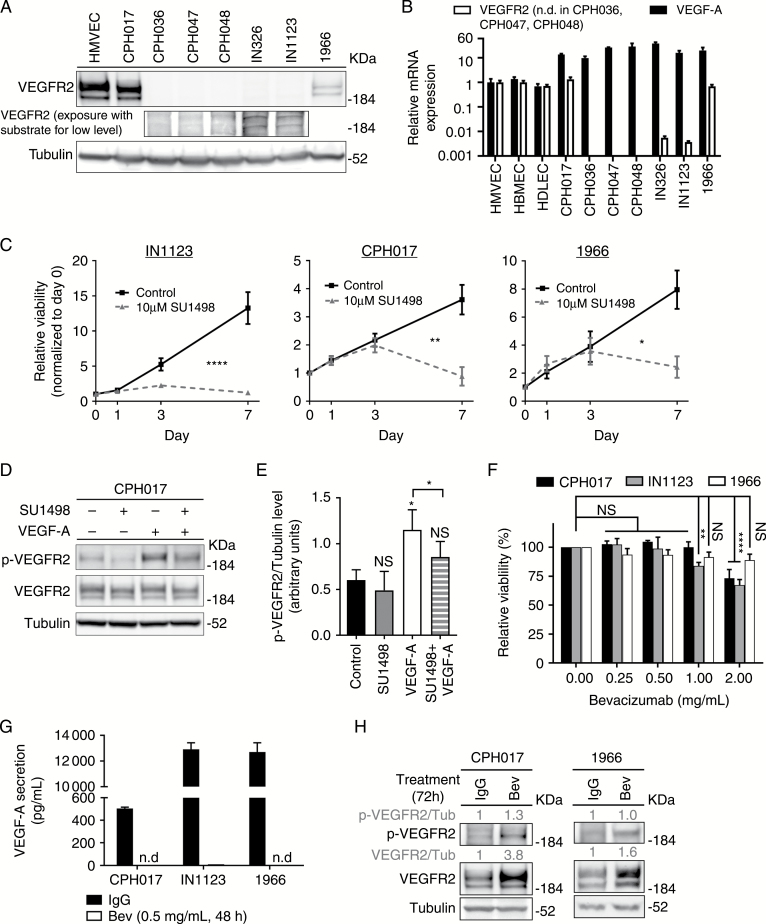
Fig. 1.
VEGFR2 tyrosine kinase expressed by glioblastoma cells remains active under bevacizumab therapy. (A) Western blot (WB) for VEGFR2 and tubulin in a panel of patient-derived glioblastoma cultures. (B) Quantitative RT-PCR analysis of VEGF-A and VEGFR2 expression in glioblastoma cells standardized to expression in human microvascular endothelial cells (HMVECs). Data are presented as mean ± SD, n = 3. The y-axis is log10 transformed. (C) Viability of CPH017, IN1123, and 1966 cells treated with SU1498 (10 µM) or left unstimulated. Data are presented as mean ± SD, n = 3. Significance determined by 2-way ANOVA with Bonferroni post-test. (D) Representative WB of total and phosphorylated VEGFR2 and tubulin in CPH017 cells plated overnight in Neurobasal media without epidermal growth factor and basic fibroblast growth factor, then treated with either SU1498 (30 µM for 3 h), VEGF-A (40 ng/mL, 15 min), or the combination (30 µM SU1498 for 3 h followed by 40 ng/mL VEGF-A for 15 min). (E) Quantification of relative phosphorylated-VEGFR2/tubulin levels from WB analysis. Data are presented as mean ± SD, n = 3. Significance determined by one-way ANOVA with Dunnett’s post-test correction and ratio paired 2-sample t-test. (F) Viability of glioblastoma cells treated 7 days with bevacizumab (Bev) (0–2 mg/mL). Data are presented as mean ± SD, n = 3. Significance determined by 2-way ANOVA with Bonferroni post-test correction. (G) ELISA quantification of VEGF-A secretion by glioblastoma cells treated with Bev (0.5 mg/mL, 48 h) or IgG control. Data are presented as mean ± SD, n = 3. N.D. denotes that signal could not be detected. (H) Representative WB of total and phosphorylated VEGFR2 or tubulin in CPH017 and 1966 cells treated for 72 h with Bev (0.5 mg/mL) or IgG. *P ≤ 0.05; **P ≤ 0.01; ****P ≤ 0.0001; NS: nonsignificant.

