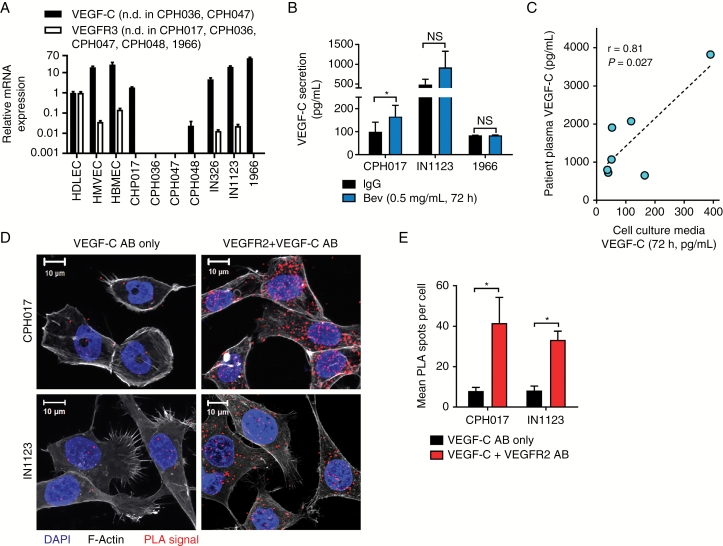
Fig. 2.
VEGF-C is expressed under bevacizumab therapy and interacts with VEGFR2 in glioblastoma cells. (A) Quantitative RT-PCR analysis of VEGF-C and VEGFR3 expression in glioblastoma cells standardized to HDLECs. Data represented as mean ± SD; n = 2. The y-axis is log10 transformed. N.D. = not detected. (B) ELISA quantification of VEGF-C secretion by glioblastoma cells treated 72 h with bevacizumab (Bev; 0.5 mg/mL) or IgG. Data represented as mean ± SEM; n = 3. Significance determined by paired 2-sample t-test. *P ≤ 0.05. (C) Correlation of VEGF-C ELISA quantification in matched samples of blood-plasma and conditioned media (72 h) from tumor-derived cell cultures of 7 glioblastoma patients. Significance was determined by Spearman’s correlation analysis. (D) Representative confocal images showing PLA signal (red), F-actin (gray), and 4′,6′-diamidino-2-phenylindole (blue) of glioblastoma cells. Staining with only VEGF-C antibody (AB) was used as a negative control. (E) Quantification of PLA dots in glioblastoma cells. Data are represented as mean ± SEM; n > 40 cells.

