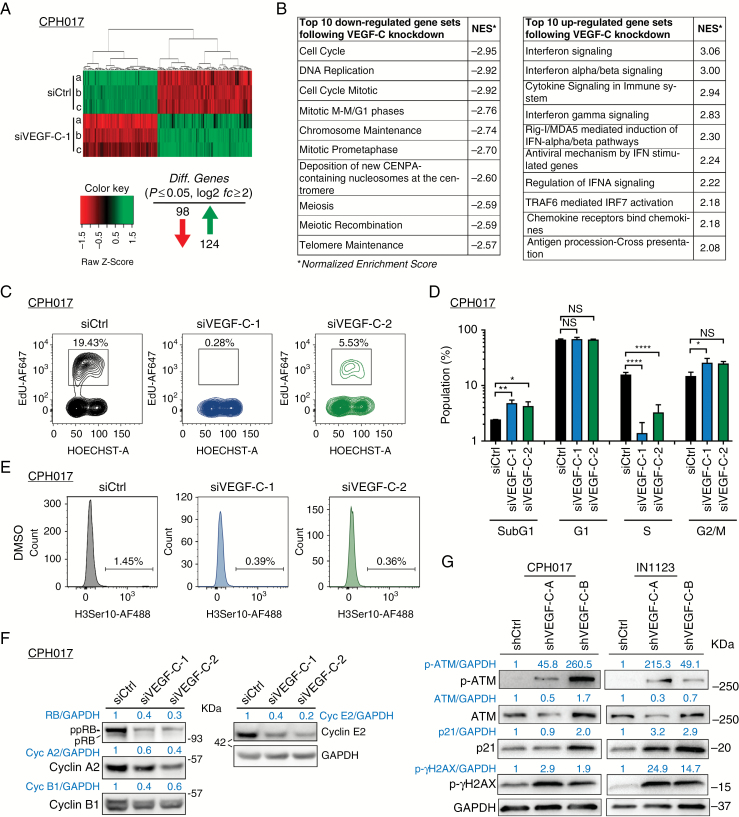
Fig. 5.
VEGF-C loss leads to transcriptional changes and cell cycle arrest in glioblastoma cells. (A) Heat map of significantly differentially expressed genes (log2fc ≥ 2 and adjusted P ≤ 0.05) 48 h after VEGF-C knockdown compared with siCtrl. (B) GSEA using a 479-gene set from the Reactome pathway database. Top 10 most significant downregulated and 10 most upregulated gene sets are shown with normalized enrichment score (NES). (C) Representative fluorescence activated cell sorting (FACS) plot showing cell cycle profile of CPH017 cells post transfection with siCtrl or siVEGF-C. (D) Quantification of sub-G1, G1, S, and G2/M cell cycle populations–based FACS analysis. Data are displayed as mean ± SEM; n = 3–4. The y-axis is log10 transformed. Statistical significance was determined by one-way ANOVA. *P ≤ 0.05; **P ≤ 0.01; ****P ≤ 0.0001; NS: nonsignificant. (E) Mitotic index (%) of CPH017 cells 72 h post siCtrl and siVEGF-C transduction. (F) WB analysis of phosphorylated and total retinoblastoma, cyclins A2/B1/E2, and glyceraldehyde 3-phosphate dehydrogenase after siCtrl and siVEGF-C transfection in glioblastoma cells. (G) WB for DNA damage markers phosphorylated and total ataxia telangiectasia mutated and gamma-H2AX in glioblastoma cells 72 h following shCtrl or shVEGF-C transduction.

