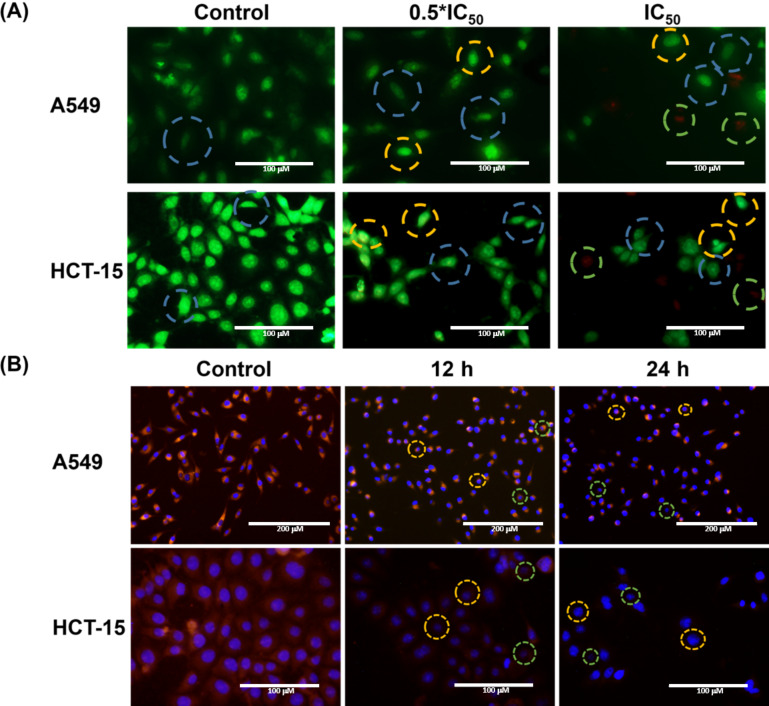
Figure 5.
Fluorescence microscopy images of (A) AO/EB stained A549 and HCT-15 cells after 0.5 IC50 and IC50 with CaP@5-FU NP treatment for 24 h, showing multiple apoptotic events and (B) Hoechst 33342 and rhodamine B stained A549 and HCT-15 cells upon 12 h and 24 h incubation with CaP@5-FU NPs with respect to the untreated control visualises the morphological changes after CaP@5-FU NP treatment. Scale bars = 100 µm, except for A549 with scale bars = 200 µm.

