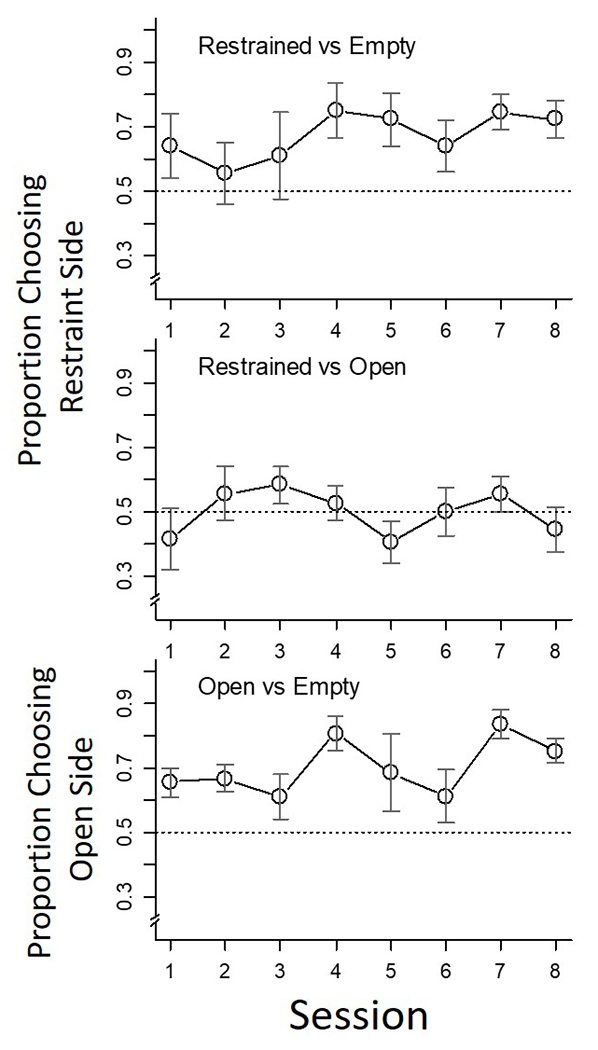
Figure 3.

Group preference data for Conditions 1 (top panel), 2 (middle panel) and 3 (bottom panel). The dotted line defines a proportion of 0.5. The range bars through each data point define +1/−1 standard error of the mean. See text for other details.
