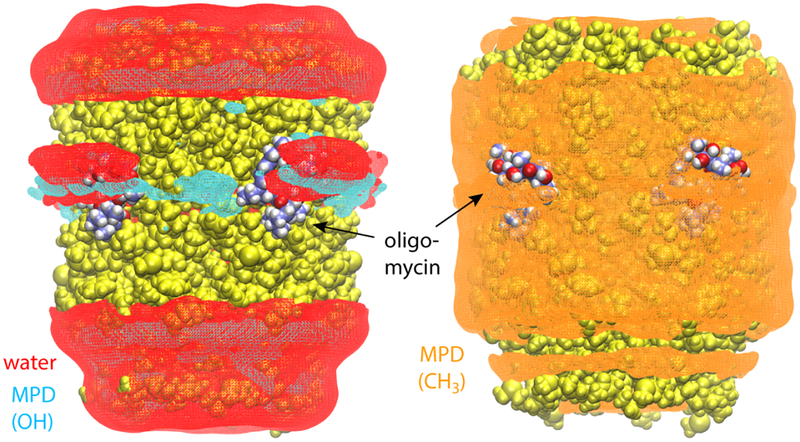
Figure 3. Partitioning of the MPD/water solvent on the surface of the ring-oligomycin complex.
The figure shows iso-surfaces of calculated 3D density maps for water and MPD within interaction distance from the protein-inhibitor complex (either via hydrogen-bonding or hydrophobic contacts), derived from the simulated trajectory (same as that in Fig. 2). The water-density map is shown in red. Density maps for the MPD hydroxyl and methyl groups, calculated separately, are shown in cyan and orange, respectively. The protein and inhibitor are shown as spheres, colored as in Fig. 2.

