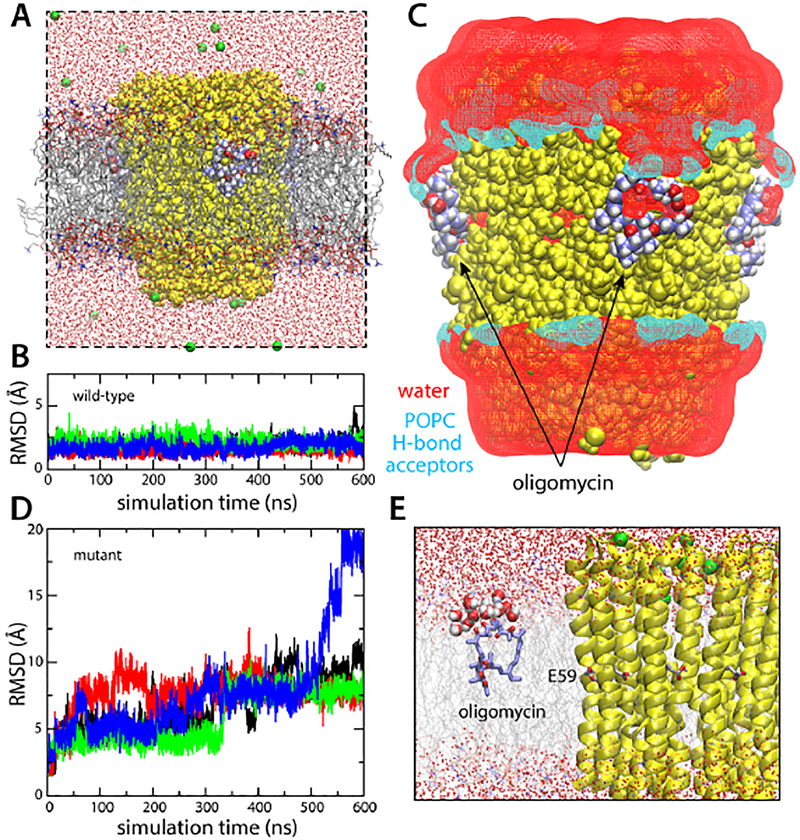
Figure 5. Simulations of the S. cerevisiae c10 ring with bound oligomycin, in a hydrated phospholipid bilayer.
(A) Simulation system. Lipid (POPC) molecules are shown as gray/red/orange/blue sticks. The rest of the system is represented as in Fig. 2. (B) RMS deviation of each of the four oligomycin molecules bound to the c-ring, relative to the observed binding pose. (C) Lipid/water structure at the protein-inhibitor interface. The figure shows iso-surfaces of 3D density maps for water and lipid, calculated analogously to those shown in Fig. 3. The water density map is shown in red. Separate density maps for POPC were calculated; the map for the potential hydrogen-bond acceptors (POPC has no potential donors) within interaction distance from the protein-inhibitor surface is shown in cyan. (D) Analysis analogous to that in (B), for a control simulation in which a series of mutations known to prevent oligomycin inhibition were introduced in the c-subunit. (E) Close up of the snapshot at the end of the control simulation, showing one of the disassociated oligomycin molecules, at the lipid-water interface.

