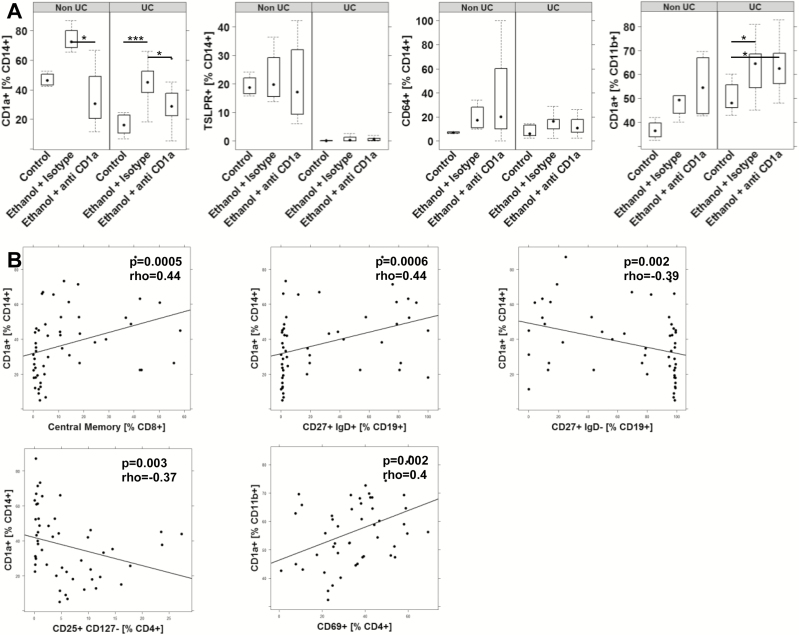
FIGURE 6.
Treatment of NSG-UC mice with anti-CD1a antibodies affects CD14+ CD1a+ monocytes. NSG mice were engrafted and treated as in Figure 5. Human leucocytes were isolated from mouse spleen and subjected to flow cytometric analysis. A, Frequencies of CD14+ CD1a+ and CD11b+ CD1a+ cells depicted as boxplot diagrams. Boxes represent upper and lower quartiles. Whiskers represent variability, and outliers are plotted as individual points. B, Correlation analysis of frequencies of CD14+ CD1a+ monocytes with subsets of B and T cells cells depicted as scatter plots. The method was Spearman; numbers display correlation coefficients (rho values) and P values.

