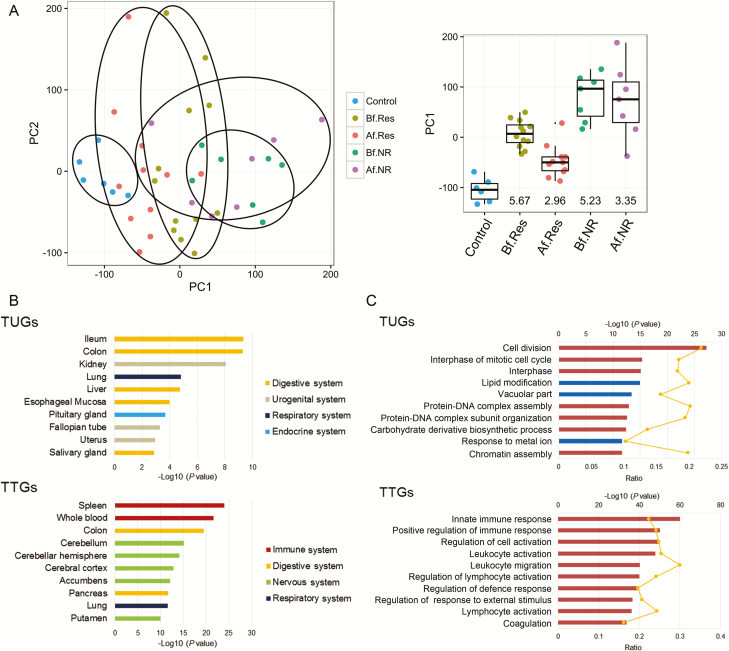
FIGURE 1.
Residual genomic profile of CD patients. A, PCA of colonic expression data from 19 patients with Crohn’s colitis (12 responders and 7 nonresponders) at the time of pre– and post–infliximab treatment and from 6 healthy controls (microarray expression data were obtained from the study by Arijs et al.16). Boxplots of PC1 distribution for each group and P values (-Log10) from the control group are as indicated on the right. B, The top 10 enriched tissue types in TUGs (upper) and TTGs (lower) using the Nextbio Body Atlas application taken from the Genotype-Tissue Expression project (GTEx) are displayed. C, The top 10 enriched GO terms in TUGs (upper) and TTGs (lower) using NextBio Pathway Enrichment application are displayed. Category names are presented on the y axis. On the x axis, the significance score (negative log of P value) for each pathway is indicated by the bars, and the line represents the ratio of genes in a given pathway that meets the cutoff criteria among total genes that make up that pathway. Red bars predict an overall increase in the activity of the pathway whereas blue bars indicate a prediction of an overall decrease in activity. Abbreviations: Af.NR, nonresponder after treatment; Af.Res, responder after treatment; Bf.NR, nonresponder before treatment; Bf.Res, responder before treatment.

