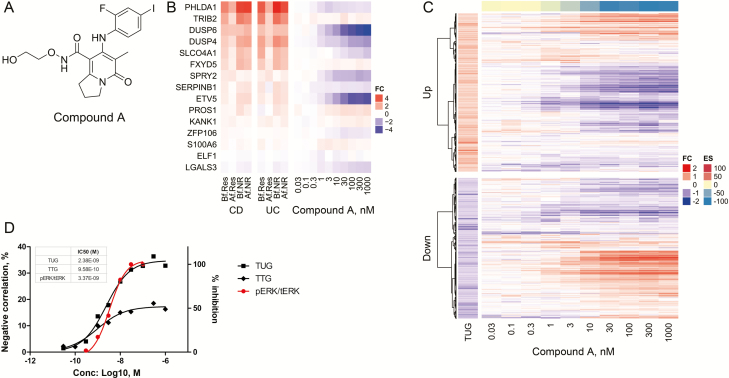
FIGURE 2.
MEK1/2 inhibitor normalized reference CD signature in LoVo cells. A, Chemical structure of Compound A. B, Heatmap showing the genes from the MEK activation signature for both CD and UC patients (left) compared with fold change in gene expression levels in LoVo treated with Compound A across 10 dose response conditions (0.03–1000 nM, n = 3, right). C, Heatmap of TUGs clustered into upregulated and downregulated genes compared with fold change in gene expression levels in LoVo treated with Compound A across 10 dose response conditions (0.03–1000 nM, n = 3), obtained by Ampli-seq analysis. The color-coded scale for the normalized expression value is indicated at the right of the figure, which correlates with color intensity to the fold change of gene expression and enrichment score. D, IC50 values were calculated by plotting both negative correlation rate between Compound A DEGs of TUGs/TTGs and in vitro pERK inhibitory activity in LoVo cells using a nonlinear regression analysis by GraphPad Prism (GraphPad, La Jolla, CA, USA).

