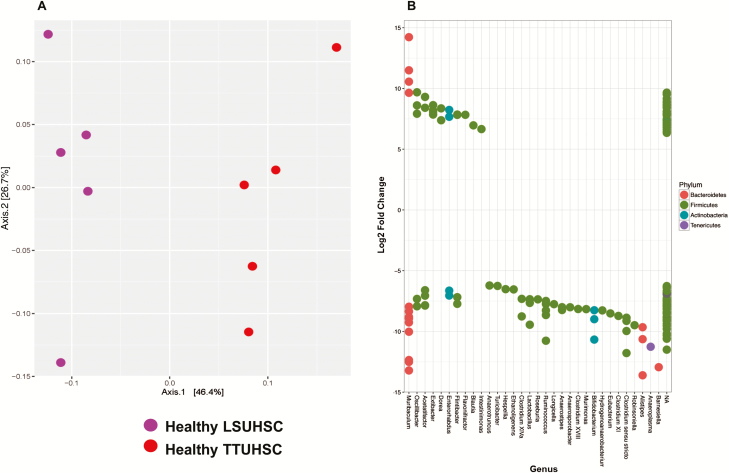
FIGURE 2.
Principal coordinate and DESeq analyses of fecal microbiota from healthy RAG -/- mice housed at LSUHSC or TTUHSC. A, Principal coordinate analysis using weighted UniFrac of fecal microbiota for healthy RAG-/- mice housed at the 2 institutions. Weighted UniFrac takes into consideration the OTU composition and relative abundance of the OTUs within a community. Each axis shows the percentage of variation that is present in the dataset, Axis1 being the largest representation of variability. LSUHSC and TTUHSC microbiota samples are shown as purple and red circles, respectively. Note the clear separation of the 2 groups indicating significant differences in the bacterial populations between the 2 institutions. B, Differential overexpression of bacterial OTUs (genera) in feces obtained from healthy RAG-/- mice housed at LSUHSC or TTUHSC. Using DESeq2 analysis, values >0 represent OTUs (genera) that are significantly overexpressed in healthy RAG-/- mice housed at TTUHSC, whereas values <0 represent genera that are significantly overrepresented in healthy mice housed at LSUHSC. Multiple dots aligning within 1 genera represent different strains and/or species.

