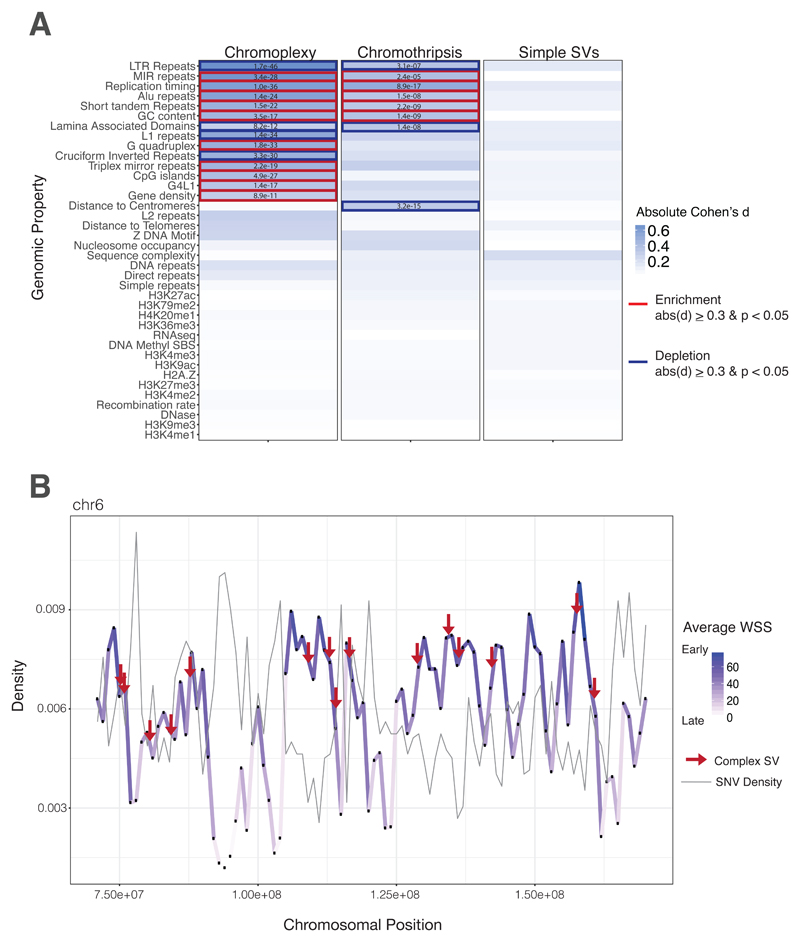
Fig. 4. Early Replicating DNA and Chromoplexy.
(A) Heatmap of genomic property associations. The genomic properties listed in supplementary table 4 were calculated for all rearrangements in both cohorts. Complex rearrangements (chromoplexy and chromothripsis), exclusively, are strongly associated with early replication timing, and other genomic features consistent with this feature (gene density, CpG density, Alu density etc.). Table values are indicative of FDR-corrected p-values compared to a million random points in the genome. Blue highlights are indicative of a Cohen’s d equal to or greater than 0.3. Bold boxes indicate a positive (red, enrichment) or negative (blue, depletion) association with the feature. All features were evaluated in 1 kb bins across the genome. For feature density metrics, associations were calculated in 1MB sliding windows centered in 1 kb bins. (B) Density distribution of the average wavelet-smoothed signal and SNVs on representative chromosome. The average wavelet-smoothed signal, of replication timing, is plotted for a subset of chromosome 6 to illustrate changes between early and late replication timing and the co-association with mutations in ES. The positional variation of replication timing across the chromosome is depicted as changes in density and color. Point mutations peak in late-replicating regions (dip in WSS, light purple), whereas complex rearrangements peak in regions of early replication timing (peak in WSS, dark purple).

