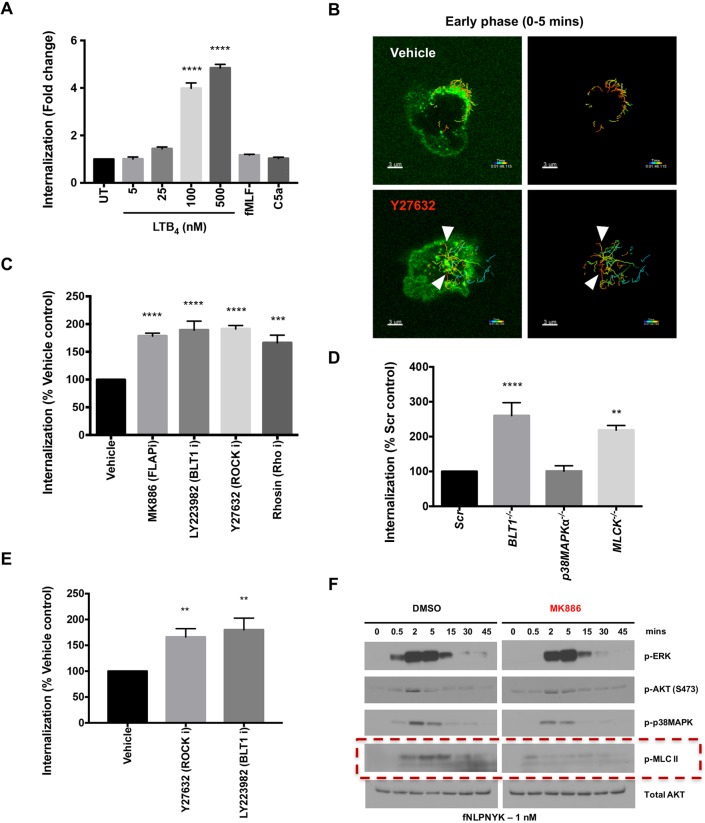
Fig. 5.
BLT1 signaling and myosin activation restrict primary GPCR internalization. (A) Graph depicting the extent of internalization of BLT1–EGFP in BLT1−/− dPLBs expressing BLT1–EGFP that were untreated (UT) or treated with the indicated concentration of LTB4, fMLF (10 nM) or C5a (250 ng/ml) for 10 min. The extent of internalization was analyzed as discussed in the Materials and Methods section. Results are presented as the fold change over UT control from n=3 independent experiments and represented as mean±s.e.m. ****P≤0.0001 (one-way ANOVA with Dunnett's multiple comparisons test). (B) Representative multiple intensity projections and the tracked vesicles across time (right-hand images) from live-cell imaging of the bottom 2 µm of PMNs pre-treated for 20 min with either DMSO (0.2% v/v) or Y27632 (25 µM) followed by fMLF–Alexa-Fluor-488 (50 nM) stimulation. White arrowheads represent the tracks of vesicles that trafficked directionally to the center of the cell in the first 5 min of Y27632 treatment. Scale bars: 3 µm. (C) Graph depicting the extent of internalization of fNLFNYK–FITC in PMNs pre-treated with vehicle [0.2% (v/v) DMSO] or inhibitors (denoted with an ‘i’ after the protein targeted) (1 µM MK886, 10 µM LY223982, 25 µM Y27632, 50 µM Rhosin) for 30 min before stimulation with fNLFNYK–FITC (2 nM) for 10 min, and fixed and co-stained with phalloidin and DAPI. The extent of internalization is compared to vehicle control with n=3 independent experiments and represented as mean±s.e.m. ***P≤0.001, ****P≤0.0001 (one-way ANOVA with Dunnett's multiple comparisons test). (D) Graph depicting the extent of internalization of fNLFNYK–FITC in Scr, BLT1−/−, p38MAPK−/− or MLCK−/− dPLBs stimulated with fNLFNYK–FITC (10 nM) for 15 min, and fixed and co-stained with phalloidin and DAPI. The extent of internalization is compared to Scr control with n=4 independent experiments and represented as mean±s.e.m. **P≤0.01, ****P≤0.0001 (one-way ANOVA with Dunnett's multiple comparisons test). (E) Graph depicting the extent of internalization of C5a–EGFP in dPLBs expressing C5aR1–EGFP pre-treated with vehicle [0.2% (v/v) DMSO] or inhibitors (25 µM Y27632, 10 µM LY223982) for 30 min before stimulation with C5a (100 ng/ml), and fixed and co-stained with phalloidin and DAPI. The extent of internalization is compared with vehicle control with n=3 independent experiments and represented as mean±s.e.m. **P≤0.01 (one-way ANOVA with Dunnett's multiple comparisons test). (F) A representative western blot analysis of protein lysates from PMNs that were pre-treated with vehicle [0.2% (v/v) DMSO] or MK886 (1 µM) for 30 min before stimulation with fNLFNYK (1 nM) for indicated time points. Red box highlights the effect of inhibitor treatment on p-MLCII. Images represent results from one of two independent experiments.

