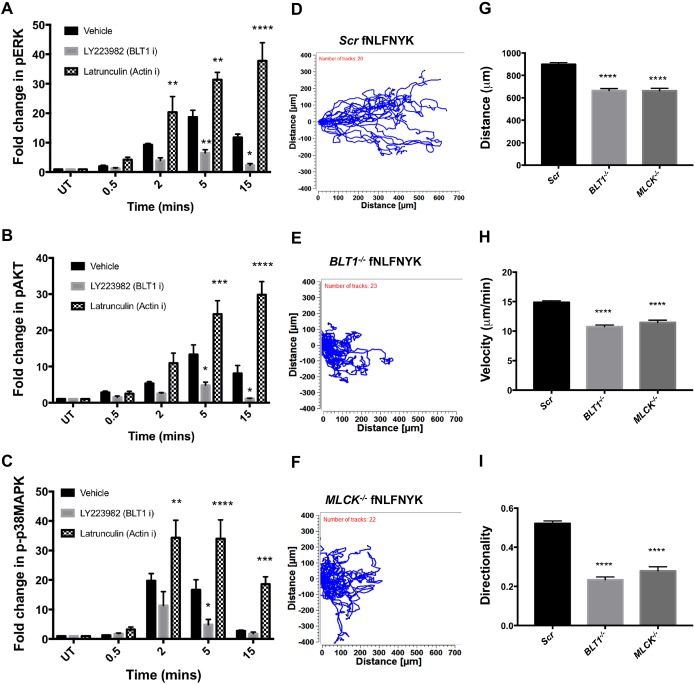
Fig. 6.
The extent of FPR1 internalization impacts downstream signaling and chemotaxis behavior. (A–C) Graph depicting the quantification of pERK (A), pAKT (B) and p-p38MAPK (C) from western blot analyses of the indicated samples (see Fig. S7A) from n=4 independent experiments, represented as mean± s.e.m. ****P≤0.0001, ***P ≤0.001, **P ≤0.01, *P≤0.05, (two-way ANOVA with Dunnett's multiple comparisons test). (D–F) Cell tracks from a single experiment where Scr (D), BLT1−/− (E) or MLCK−/− (F) dPLBs were allowed to migrate in a gradient established from 100 nM of fNLFNYK in an under agarose assay. (G–I) The distance (G), velocity (H) and directionality (I) of Scr, BLT1−/− or MLCK−/− cells migrating in a gradient of fNLFNYK (see D,E). A minimum of 20 cells were manually tracked for each cell line in a single experiment with n=3 independent experiments and results are represented as mean±s.e.m. ****P≤0.0001 (one-way ANOVA involving Dunnett's multiple comparisons test).

