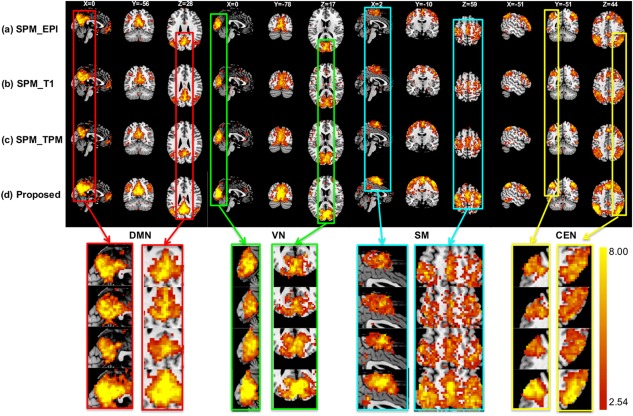
The group
t maps of four networks with
t > 2.54 (
p < .01) after registration by (a) SPM using the mean image of fMRI, (b) SPM using tissue probability maps, (c) SPM using T1 MR images, and (d) our proposed method. The threshold is set to
t > 2.54 (
p < .01). Zoom‐in views are also shown in the bottom of this figure [Color figure can be viewed at
http://wileyonlinelibrary.com]

