
Figure 9.
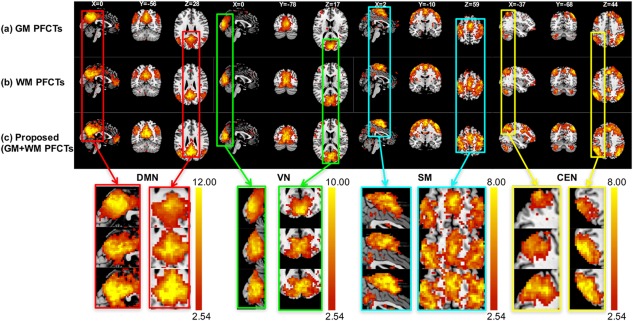
The group t maps of four networks with t > 2.54 (p < .01) after registration by (a) GM PFCTs, (b) WM PFCTs, and (c) GM + WM ts‐PFCTs (proposed method). The threshold is set to t > 2.54 (p < .01). Close‐up views are also shown at the bottom [Color figure can be viewed at http://wileyonlinelibrary.com]