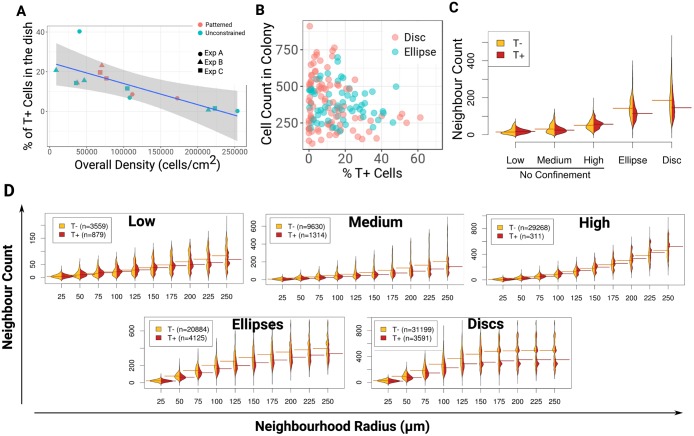
Fig. 3.
Bulk cell density defines the percentage of T+ cells and cell clustering imparts T patterning. (A) Evolution of the percentage of T+ cells with global cell density. A linear regression fitted on unconfined cultures data points is shown with the shaded region indicating the 95% confidence interval. (B) Percentage of T+ cells versus the total number of cells within each colony grown on disc or ellipse micropatterns. (C,D) Split bean plots of the distributions of the neighbour count around each T− (orange) or T+ (red) cells. Horizontal lines indicate the median. (C) Experimental conditions comparison using a fixed radius (75 µm). (D) Comparison of increasing radii for each condition.

