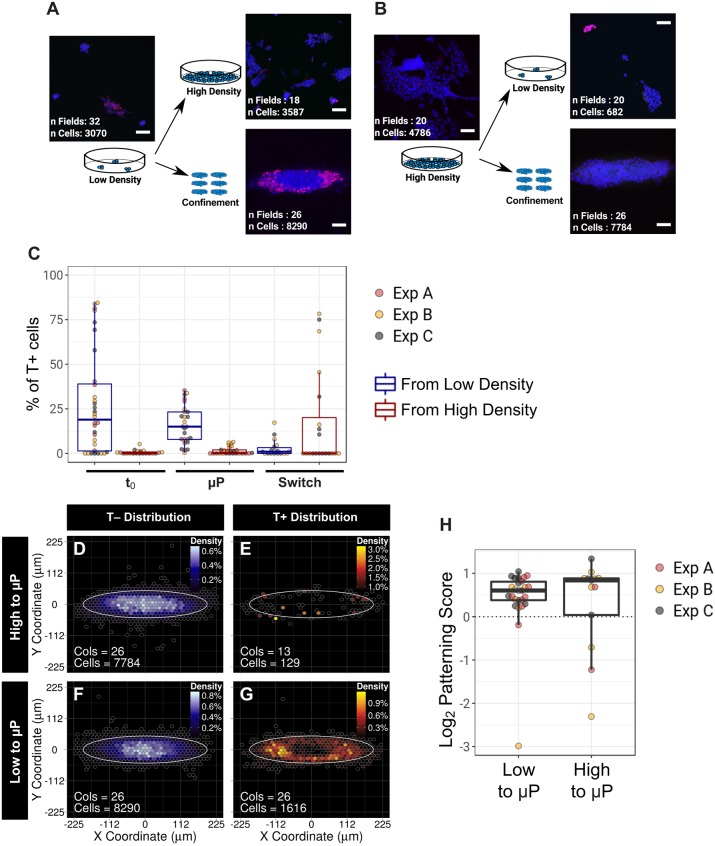
Fig. 4.
The size of the T+ population is a consequence of both current and past culture density. (A,B) Overview of the ‘memory test’ experiment. Sample images for each condition are shown (red, Tbra; blue, DAPI). n Fields, number of fields taken into account; n Cells, number of detected cells across three independent experiments. (C) Percentage of T+ cells observed in the ‘memory test’ experiment. Each data point corresponds to the percentage of T+ cells observed in one field of view. The colours of the box plots indicate whether the cells have been pre-cultured at low or high density. t0, observation before re-plating the cells; µP, 48 h on micropatterns; switch, 48 h at the opposite density (unconstrained). (D-G) BDM of T− and T+ cells grown on ellipse micropatterns after pre-conditioning the cells at either low or high density. (H) Variability of the patterning score observed for individual ellipses. In C and H, data points are colour-coded by experimental replicates.

