Fig. 6.
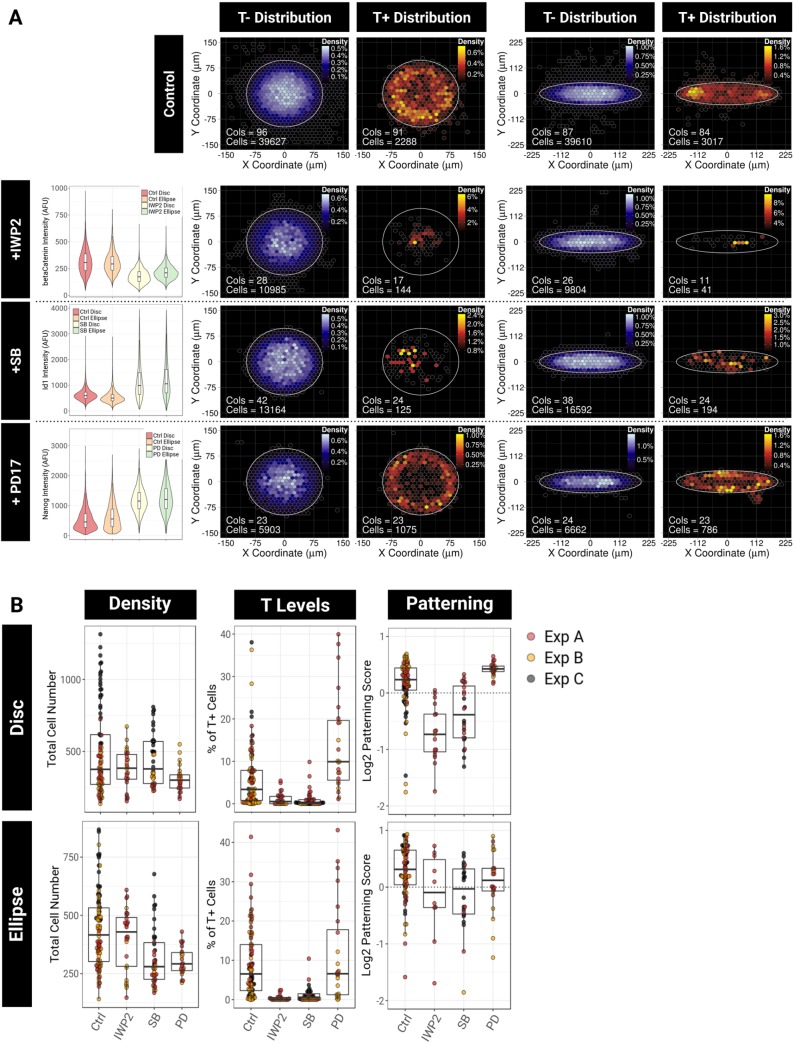
Nodal, Wnt and FGF signalling regulate the emergence and positioning of T+ cells in the culture. (A) BDMs of the localisation of T− and T+ cells for colonies grown on disc or ellipse micropatterns with or without 48 h pathway inhibitor treatment. SB, 10 µM SB-431542 (Nodal/activin inhibitor); IWP2, 5 µM (Wnt inhibitor); PD17, 100 nM PD-173074 (Fgf inhibitor). Violin plots of the distribution of qIF intensities of a pathway reporter are shown on the left of BDMs. AFU, arbitrary fluorescence unit. (B) Beeswarm box plots representing, for discs (top row) and ellipses (bottom row), the total cell number per colony, the percentage of T+ cells and the log2 of the patterning score. Colours indicate three independent experiments.

