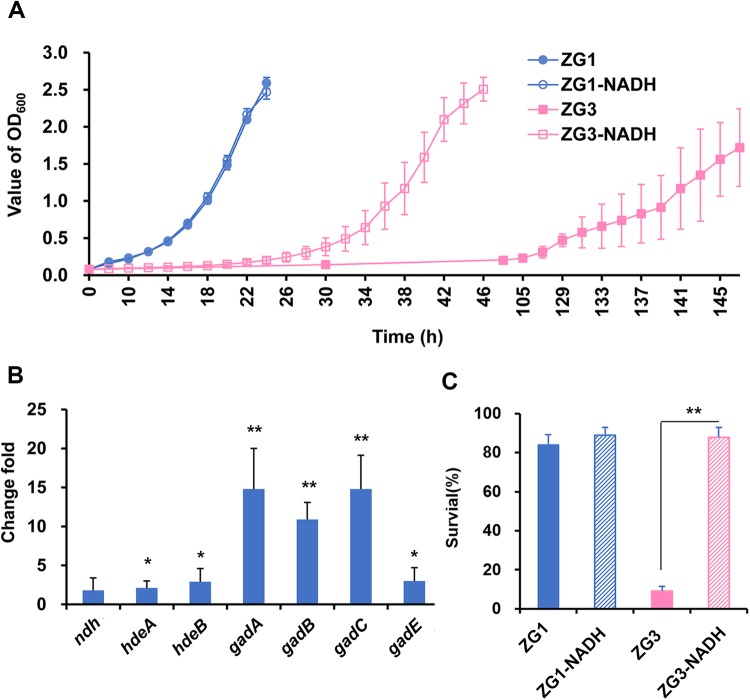
Fig. 4.
The effect of NADH on the WT and ZG3 strains. (A) Growth curves for ZG1 (icdANADP, WT) and ZG3 (icdANADPΔudhA) with or without NADH supplementation. ZG1-NADH and ZG3-NADH indicate that NADH was added to the culture medium at the beginning. The dashed line represents the long lag phase of ZG3. The growth rate of ZG3-NADH was significantly faster than that of ZG3 (P<0.05). (B) Q-PCR results regarding gene expression levels in ZG3-NADH compared with ZG1-NADH. (C) Acid resistance assay for ZG1 and ZG3 cells with or without NADH supplementation. Data are presented as the mean±s.d. of three independent experiments. *P<0.05. **P<0.01.

