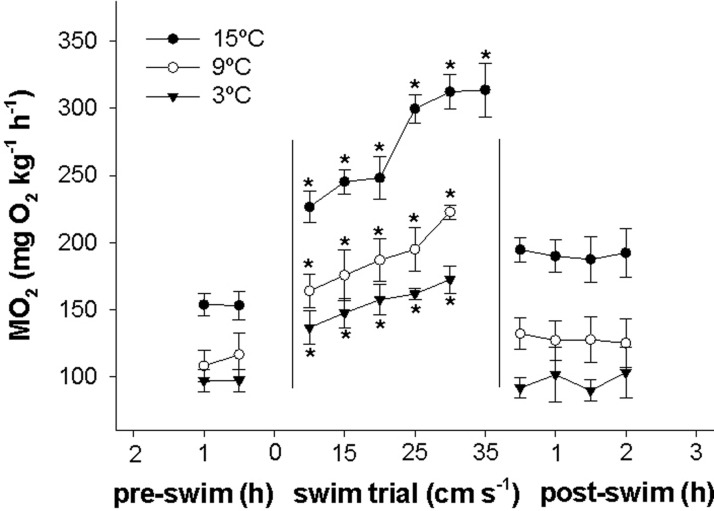
Fig. 3.
MO2 of lumpfish before, during and after swim trials at 3, 9 and 15°C. The first two points at each temperature correspond to the routine MO2 before swimming was initiated. The following points are MO2 while swimming at increasingly higher speeds until maximum capacity. The final four points at each temperature represents MO2 over a 2 h period after swimming to exhaustion. Asterisks indicate a significant difference in MO2 compared to 1 h before swim trials at each respective temperature. N=8. Data are mean±s.e.m.

