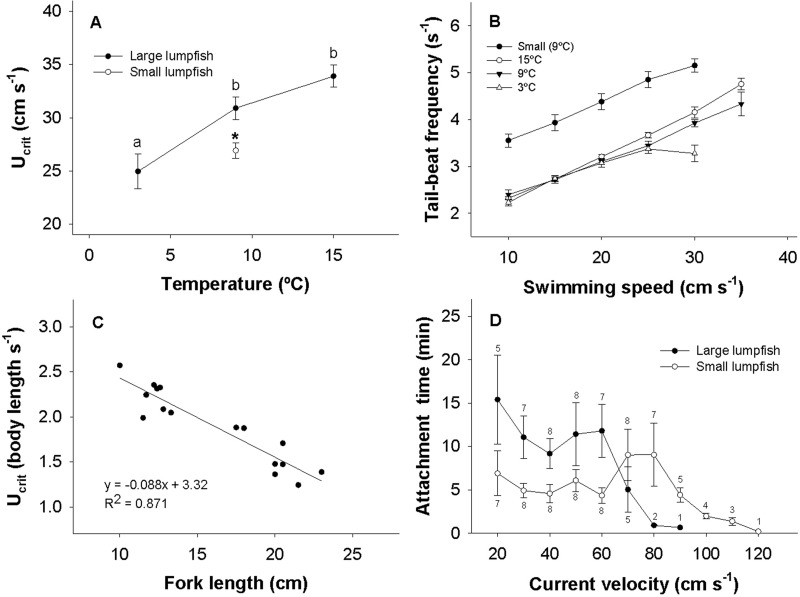
Fig. 4.
Swimming performance of lumpfish. (A) The absolute critical swimming speed (Ucrit) of lumpfish at different acclimation temperatures and size classes. (B) Tail-beat frequency of lumpfish as a function of swimming speed at different acclimation temperatures and size classes. (C) Scatterplot and linear regression of relative Ucrit versus fork length of lumpfish at 9°C. (D) Longest observed attachment time as a function of current velocity in large and small lumpfish at 9°C. Relevant statistical differences are indicated with different symbols. N=8 in A, B and D. Numbers in D represent how many fish were observed to attach in specific current velocities. Data are mean±s.e.m.

