Fig. 2.
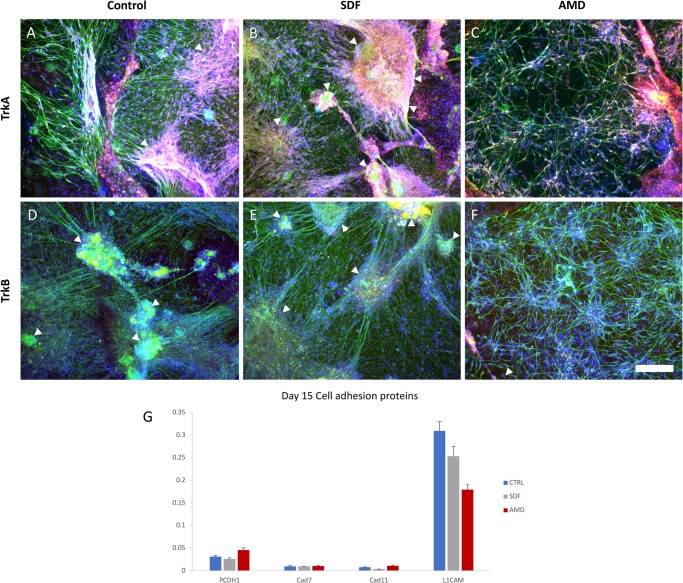
Culture morphology and cell adhesion molecule expression analysis after CXCR4 stimulation or inhibition. (A,B,C) Day 15 cultures from the control, SDF1 (agonist) and AMD3100 (antagonist) groups stained for TrkA (red, nociceptive marker), nuclei (blue) and beta-III-tubulin (green, neurite marker). (D,E,F) Day 15 cultures from the Control, SDF1 and AMD3100 groups stained for TrkB (red, mechanoreceptive marker), nuceli (blue) and beta-III-tubulin (green, neurite marker). Control (with endogenous SDF1) and SDF1-stimulated differentiation cultures develop into DRG-like clusters of radially projecting nociceptive neurons (arrows), whereas inhibitory conditions result in a more evenly distributed phenotype when looking at beta-III-tubulin staining (N=3 per condition, none excluded). (G) Comparison of transcript levels of various cell adhesion proteins between the differentiation groups relative to GAPDH (Single cDNA pool from two replications). Error bars: standard deviation of qPCR replications. Scale bar: 150 µm.

