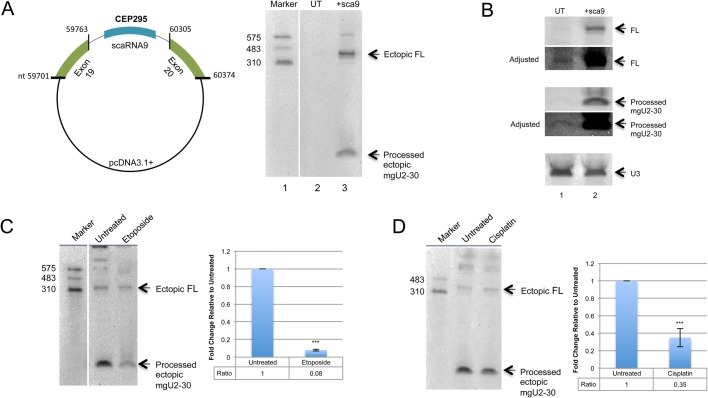
Fig. 2.
Etoposide and cisplatin alter the dynamics of full-length scaRNA9 and the mgU2-30 fragment. (A) Left, schematic of the plasmid used for scaRNA9 expression from the CEP295 host gene. Right, 10 µg of RNA from untransfected (UT) or scaRNA9 transfected cells was subjected to electrophoresis, northern blotting, and detection with a 5′ DIG probe to scaRNA9. Endogenous full-length scaRNA9 (lane 2) is only slightly visible compared to ectopic full-length (FL) scaRNA9 (lane 3). The mgU2-30 processed fragment is easily detected in RNA isolated from cells transfected with scaRNA9 (lane 3). (B) Northern blot showing endogenous and ectopic scaRNA9 FL and mgU2-30 fragment. 10 µg of RNA from untransfected (UT) or scaRNA9 transfected cells was subjected to electrophoresis, northern blotting, and detection with a 5′ and 3′ labeled DIG probe to scaRNA9. Endogenous FL scaRNA9 signal (lane 1) is very faint compared to that obtained in scaRNA9 expressing RNA (lane 2). An adjusted image is shown to more easily identify endogenous FL scaRNA9. Likewise, the mgU2-30 fragment is easily detectable in RNA from cells expressing scaRNA9, endogenous mgU2-30 is more difficult to detect. An adjusted image is shown to more easily identify endogenous mgU2-30. The same membrane was reprobed for U3 snoRNA (snord3) to verify that approximately equal amounts of RNA was loaded in each lane (lower panel). (C,D) HeLa cells were transfected with scaRNA9 pcDNA3.1+ for 24 h. 7.5 μM etoposide (C) or 3 μg/ml cisplatin (D). Treatments occurred 7 h after transfection. scaRNA9 was detected after northern blot detection using a 5′ DIG labeled probe. Histograms were generated from the quantified images by normalizing the processed mgU2-30 signal to the full-length scaRNA9 signal. The data for the treated samples was then normalized to the fragment/full-length ratio obtained for untreated RNA. ***P-value <0.0005, error bars represent standard deviation. N=5 for etoposide treatments and n=7 for cisplatin treatments with n representing biological repeats.

