Fig. 3.
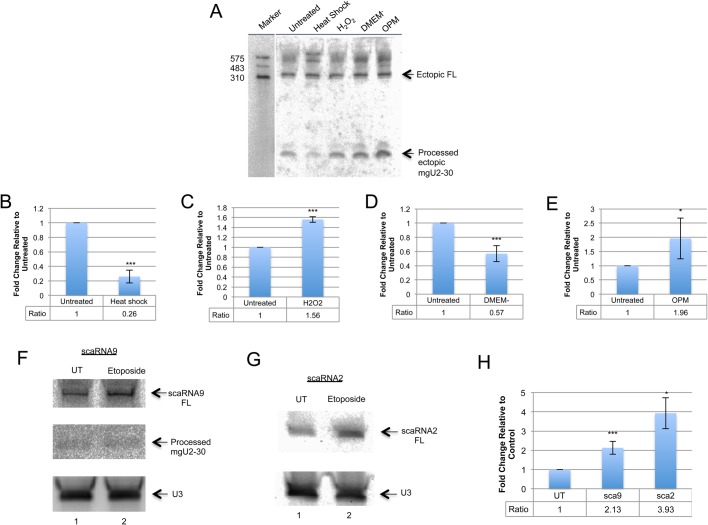
Stress conditions differentially affect the dynamics of ectopic scaRNA9 and endogenous scaRNA 9 and 2. (A) HeLa cells were transfected with scaRNA9 pcDNA3.1+ for 24 h and treatments occurred 7 h after initial transfection: 42°C incubation (heat shock) n=6, 0.2 mM H2O2 (oxidative stress) n=6, DMEM lacking serum (DMEM−) n=7, or Optimem reduced serum medium (OPM) n=7. scaRNA9 was detected after northern transfer using a mixture of a 5′ DIG labeled and 3′ DIG labeled probe. (B-E) Histograms were generated after using the volume analyze tool on the adjusted image to quantify the ratio of the processed mgU2-30 fragment to the full-length scaRNA9. The treated condition was then normalized to the untreated. *P-value <0.05; ***P-value <0.0005, error bars represent standard error. (F,G) HeLa cells were treated with 17 μM etoposide for 24 h. Northern blots using probes for scaRNA9 (F) or scaRNA2 (G) show etoposide treated cells (lane 2) have an increase in full-length signal compared to untreated (lane 1). (H) A histogram was generated by normalizing the full-length signal to the snoRNA U3 signal. N=14 for scaRNA9 data and n=5 for scaRNA2 data (*P-value <0.05; ***P-value <0.0005, error bars represent standard error). In all cases ‘n’ equals biological repeats.

