Fig. 8.
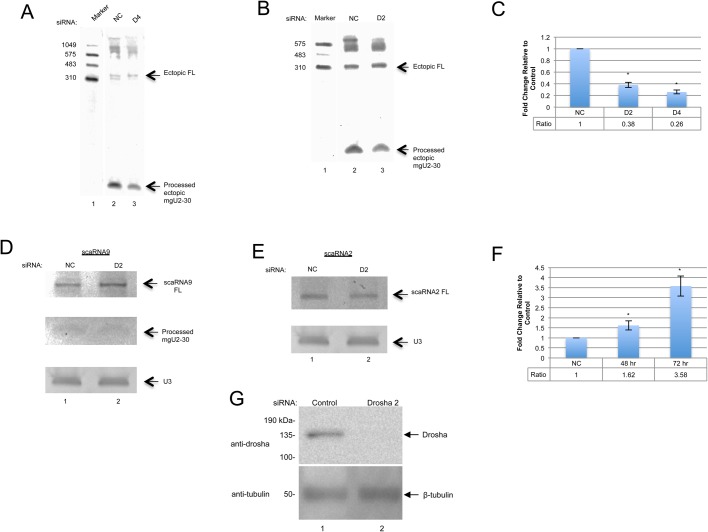
Identification of Drosha as a factor that impacts on scaRNA 2 and 9 dynamics. (A-C) Northern blots of RNA from HeLa cells transfected with negative control (A,B, lane 2), Drosha 4 (A, lane 3), or Drosha 2 (B, lane 3) siRNA for 24 h and then transfected with pcDNA 3.1+ scaRNA9 for 24 h. A 5′ DIG probe to scaRNA9 was used. A histogram (C) was generated from the quantified images by normalizing the processed mgU2-30 signal to the full-length scaRNA9 signal. Data for the knockdown samples was then normalized to the fragment/full-length ratio obtained for control RNA. Standard error was used to generate error bars. Student’s t-test was used to determine statistical significance, indicated by * corresponding to a P-value <0.05. N=25 for control treatments, n=21 for D2 treatments and n=6 for D4 treatments. (D-F) Northern blots of endogenous RNA from HeLa cells transfected with negative control (lane 1) or Drosha 2 (lane 2), siRNA for 72 h and then probed for scaRNA9 (D) or scaRNA2 (E). A histogram (F) was generated for the scaRNA9 data by normalizing the full-length signal to the snoRNA U3 signal. N=7 for 48 h treatments (not shown) and n=5 for 72 h treatments. (G) Western blot showing Drosha knockdown. HeLa cells were transfected with negative control or Drosha 2 siRNA for 48 h (lanes 1 and 2). The membrane was then probed with Drosha antibody. β-tubulin was probed lastly as a control. In all cases ‘n’ equals biological repeats.

