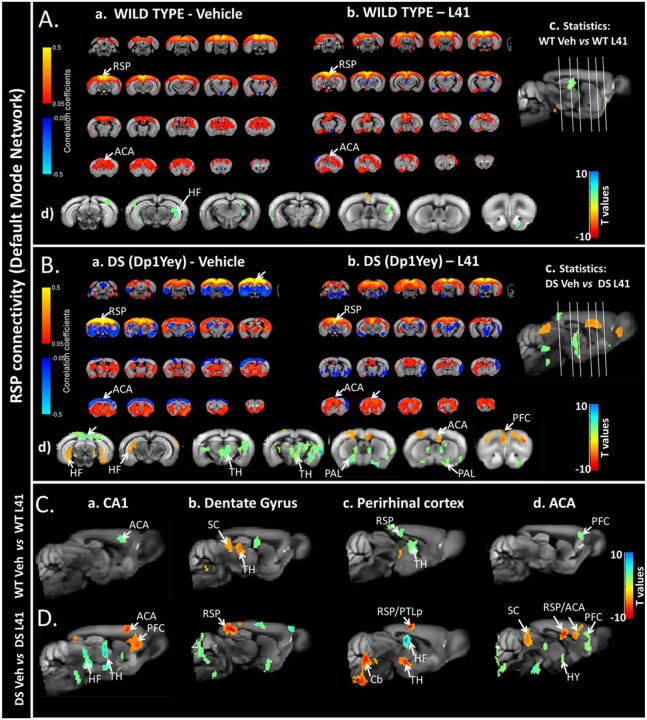
Fig. 3.
Influence of L41 on mouse brain functional connectivity (FC) patterns mapped via rsfMRI. (A,B) Default mode network (DMN) pattern in wt (a) and Dp1Yey (b) animals, mapped using the RSP cortex (core hub of DMN) as a seed region. A-a shows the typical DMN-like pattern observed in mice, spatially covering the middle rostrocaudal cortical axis of wt animals treated with vehicle, connecting the RSP and ACA. As shown in B-b, L41 treatment in wt animals slightly modifies the DMN patterns compared with wt-vehicle (see also statistics in A-c, sagittal view and A-d, coronal view; two-tailed Student's t-test, P<0.01). Red-orange scale quantifies the areas in which L41 treatment results in increased FC of wt-L41 compared with wt-vehicle. Blue-green scale indicates areas with decreased RSP connectivity after L41 treatment, compared with vehicle-treated wt mice. B-a demonstrates strongly altered DMN in vehicle-treated Dp1Yey compared with wt vehicle-treated animals (A-a, wt-vehicle), highlighting the pathological connectivity features of the mutant animals. As shown in B-b, L41 treatment in mutant Dp1Yey animals (DP16-L41) strongly modifies the DMN, restoring the positive correlations (red) of the RSP with the frontal brain areas (arrows, B-b). Voxel-wise statistics shown in B-c and B-d indicate, in red-orange, the areas in which L41 treatment results in increased FC of the DP16-L41 group compared with the DP16-vehicle group. Blue-green scale indicates areas with decreased RSP connectivity after L41 treatment, compared with the vehicle-treated group mutant mice. In A-a,b and B-a,b, red indicates the positively correlated areas (0.1 to 0.5 correlation coefficients); blue indicates negatively correlated areas (–0.1 to –0.5 correlation coefficients). (C,D) FC patterns in wt (C) and Dp1Yey (D) animals after L41 treatment: C-a, CA1 FC; C-b, dentate gyrus FC; C-c, perirhinal cortex FC; C-d, ACA FC (two-tailed Student's t-test, P<0.01). Red-orange shows the brain areas in which L41 treatment results in increased FC; blue-green indicates areas with decreased connectivity after L41 treatment, compared with vehicle-treated mice. ACA, rostral and medial anterior cingulate cortex; Cb, cerebellum; HF, hippocampal formation; HY, hypothalamus; PAL, pallidum; PFC, prefrontal cortex; PTLp, posterior parietal association areas; RSP, retrosplenial cortex; SC, superior colliculus; TH, thalamus.

