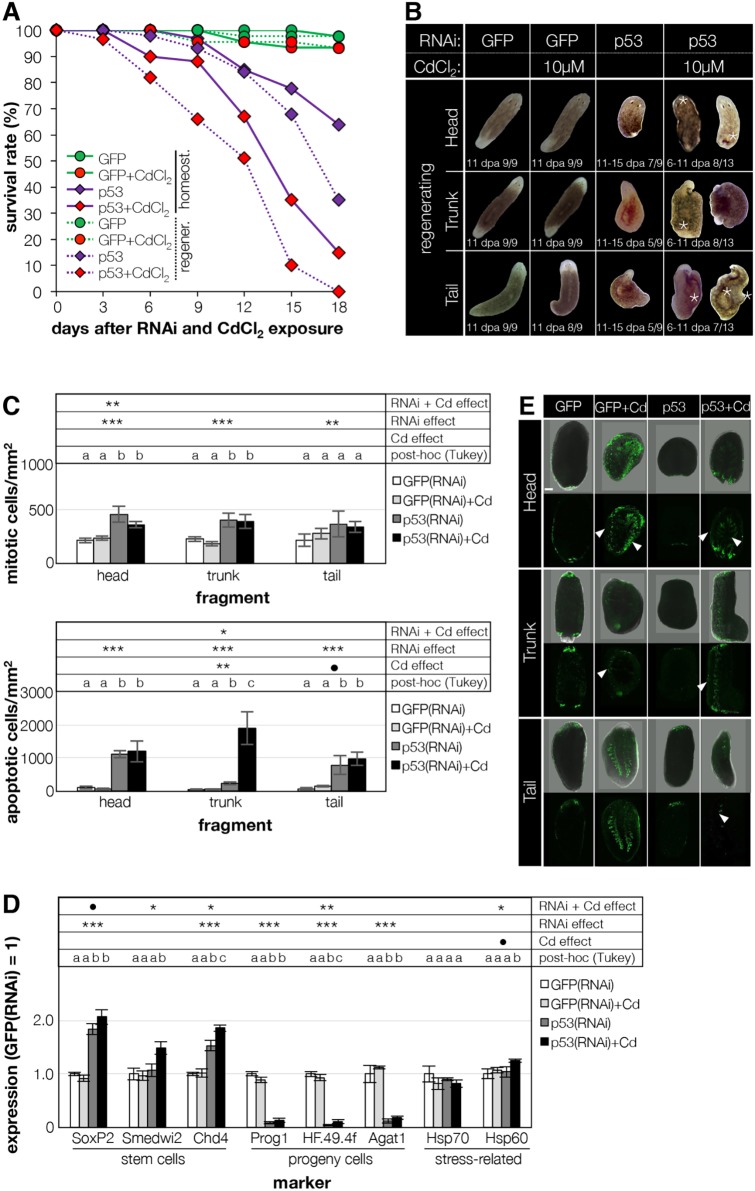
Fig. 2.
Cd exacerbates the p53KD phenotype. (A) Survival curve after p53 KD in the presence or absence of the carcinogenic compound CdCl2. Data represent the average of two experiments (n=9-18 per group for regenerating animals; n=12 per group for homeostatic animals). (B) The presence of Cd increased the incidence of the p53(RNAi) phenotype and accelerated its onset. Dorsal outgrowths (asterisks) and bloating were only observed in Cd-treated fragments. Animals used for the experiments were starved for 2 weeks prior to use and had a length of 6 mm. (C) Mitotic (upper panel) and apoptotic (lower panel) figures were counted in regenerating fragments at 11 dpa, and normalized against the body area. Values are mean±s.e.m. of three to six biological replicates. (D) The expression of stem cell, progeny and stress-related genes was assessed via qPCR in regenerating head, trunk and tail fragments at 11 dpa (trunk fragments are shown as representative). Values represent the mean±s.e.m. of four to six biological replicates; expression is relative to that of GFP(RNAi) fragments (=1). Significance relative to the effect of RNAi alone, Cd alone or their combination was calculated with ANOVA and the results are shown in the table at the top of the chart: ●P≤0.1; *P≤0.05; **P≤0.01; ***P≤0.001; different letters in post hoc analysis indicate P≤0.05. Animals used for experiments were starved for 2 weeks and had a length of 6 mm. (E) The production of ROS was assessed in regenerating fragments at 3 hours post-amputation in the presence or absence of 50 µM CdCl2 via incubation with 25 µM carboxy-H2DFCA. Representative head, trunk and tail fragments are shown (top, bright field+fluorescence; bottom, fluorescence only) for the four experimental conditions tested. ROS were found at both amputation sites in all specimens, and along the intestinal branches in Cd-treated animals only [white arrowheads; n=0/18, 20/33, 0/15 and 18/24 for GFP(RNAi), GFP(RNAi)+Cd, p53(RNAi) and p53(RNAi)+Cd, respectively]. Scale bar: 100 µm.

