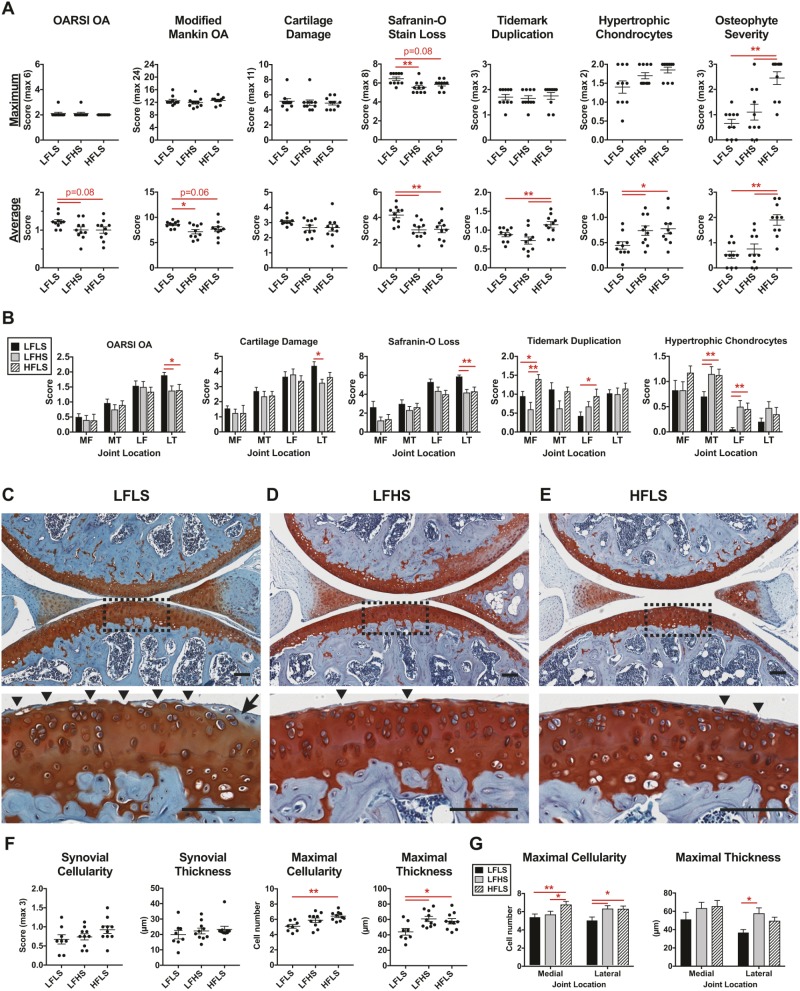
Fig. 3.
Dietary sucrose and fat independently alter knee OA pathology. (A) Cartilage OA histopathology scoring of medial and lateral knee compartments. Osteophyte scoring from medial tibial compartment. Data points represent values for individual animals, and horizontal bars are mean±s.e.m. (B) Location-specific OA histopathology (LF, lateral femur; LT, lateral tibia; MF, medial femur; MT, medial tibia). Data are mean±s.e.m. (C-E) Representative sagittal section histology images from the lateral knee compartment. Scale bars: 100 µm. Dashed line rectangular area from the lateral tibial plateau is shown at higher magnification in the lower image to illustrate the greater prevalence of cartilage fibrillation (arrowheads) and Safranin-O staining loss (arrow) in the LFLS group than in the LFHS and HFLS groups. (F) Representative and maximal synovial lining cellularity and thickness. (G) Maximal focal synovial cellularity and thickness by joint compartment. Lines over bars indicate statistically significant differences (*P<0.05, **P<0.01) by Kruskal–Wallis (A,F) or repeated-measures two-way ANOVA (B,G) with FDR-corrected post hoc tests (0.05). n=10 for each diet group, except for the LFLS group in F and G (n=8).

