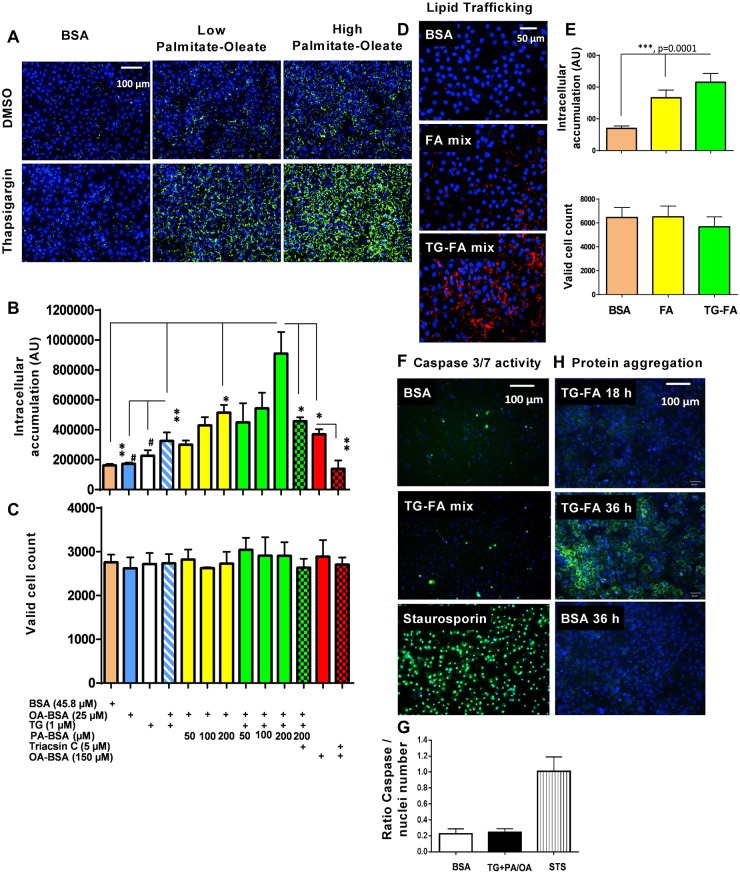
Fig. 1.
Development of steatotic phenotype in hiPSC-Hep. (A) BODIPY 493/503 staining of neutral lipid droplet (green) induced by co-treating cells with 50 (low) or 200 (high) µM PA and 25 µM OA with or without thapsigargin (TG) for 18 h compared with BSA-treated cells; nuclei were stained with Hoechst dye (blue). Scale bar: 100 µm. (B,C) Quantification of immunofluorescence in A in the BODIPY channel for lipid accumulation (B) and nuclear channel for number of valid nuclei (C). Data are mean±s.d. for three experimental determinations, where each determination includes the average of three wells and seven fields per well. *P≤0.01; **P≤0.006; #P≤0.03. (D) 10 µM fluorescent fatty acid (FA) C12 analog uptake and accumulation in the BODIPY-FA 558/568 channel (red) in the presence of BSA, FA mix and TG-FA cocktail (TG-FA mix) treatments. Scale bar: 50 µm. (E) Quantification of fluorescent FA analog in BODIPY 558/568 and nuclear channels. (F) Evaluation of caspase 3/7 enzyme activation by confocal live imaging of hiPSC-Hep treated with BSA, TG-FA cocktail or staurosporin control for 18 h in the presence of CellEvent dye (green) and Hoechst (blue). Scale bar: 100 µm. (G) Quantification of caspase 3/7-positive hiPSC-Hep. Data are mean±s.d for two experimental determinations, where each determination includes the average of three wells and seven fields per well. (H) Evaluation of unfolded protein accumulation by confocal live imaging of hiPSC-Hep co-treated with 10 µM Thioflavin T and TG-FA cocktail and captured at 18 h and 36 h. Images of cells treated with BSA were used as a negative control. Scale bar: 100 µm.

