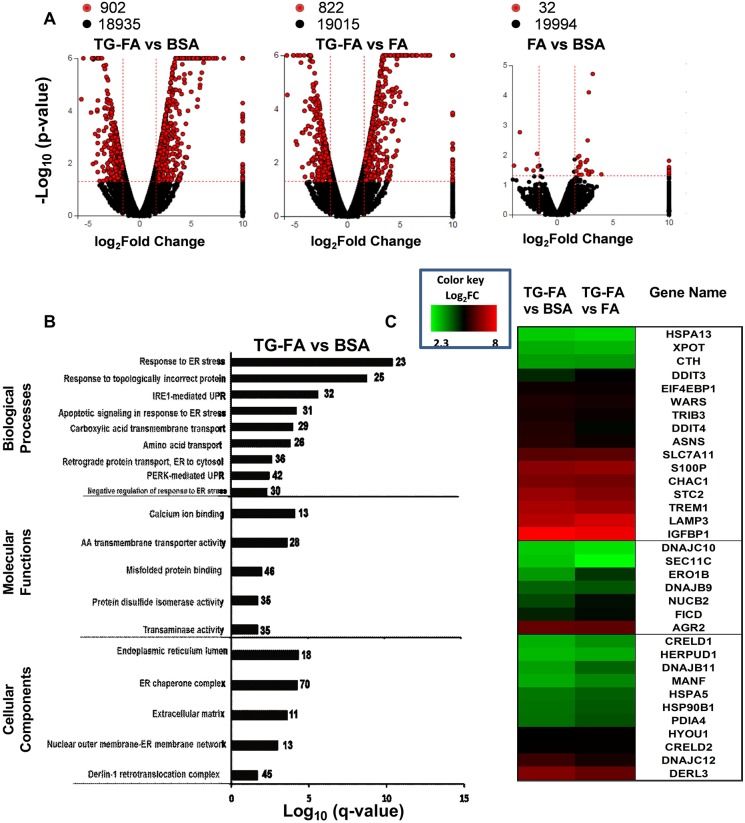
Fig. 2.
Transcriptome and GO enrichment analysis. (A) Global gene expression changes at the RNA level are shown in volcano plots of log2 fold change (log2FC) versus –log10 P-value for the three treatment groups. Red circles indicate global DEGs (P<0.05 with 1.6 log2FC cutoff); black circles denote non-DEGs. Data are representative of two independent RNA-seq determinations. (B) Bar chart representing the top over-represented GO categories with significant normalized enrichment scores according to the false discovery rate P-value (–log10 q-value cutoff 0.002), plotted relative to the pathway based on the measured expression changes induced across the pathway topology after treatment for 18 h with TG-FA, normalization to BSA and calculation by iPathwayGuide; the impact of each pathway is plotted relative to the number (noted to the right of bars) of DEGs enriched in each pathway. (C) Comparative heat map gene expression analysis of the effect of induced ER stress. DEGs associated with UPR pathways treated for 18 h with TG-FA were normalized to BSA (left column) or FA (right column) and color coded as log2FC from 2.3 to 8.0 with a q-value ≤0.05.

