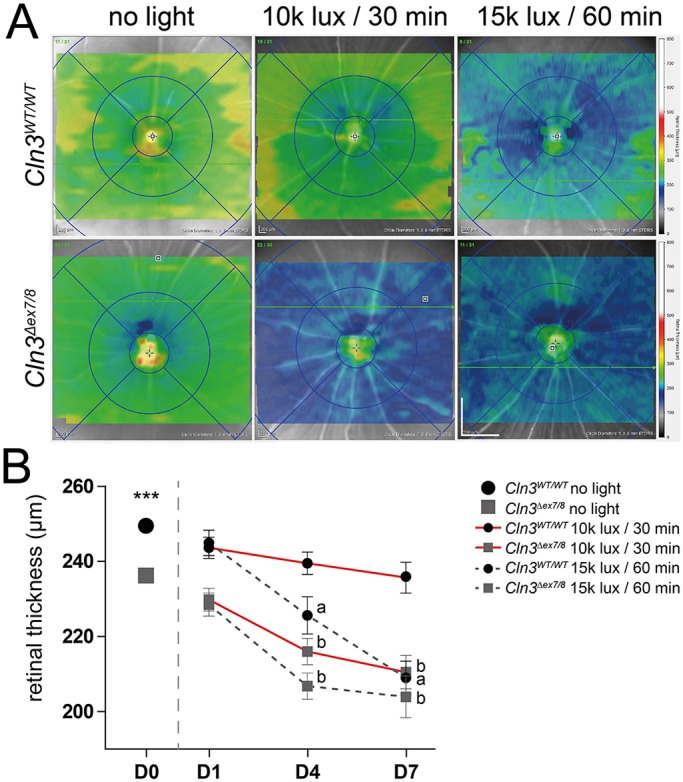
Fig. 2.

SD-OCT thickness map shows retinal thinning in ‘low light’ conditions for CLN3-deficient mice and in ‘high light’ conditions for CLN3-deficient and wild-type mice. (A) Representative SD-OCT thickness maps taken 7 days after light exposure shown for ‘low light’ and ‘high light’ conditions in modified Cln3Δex7/8 and wild-type mice. Scale bar: 1 mm. (B) Analysis of data from unexposed mice showed significant thinning of CLN3-deficient retinas compared to wild-type mice (n=43 animals). Quantification of thickness maps from light-exposed animals showed significantly different thinning in the central retinas between CLN3-deficient and wild-type retinas after exposure to ‘low light’ conditions and no significant difference in retinal thickness between both genotypes after ‘high light’ exposure. Data show mean±s.e.m. from four independent experiments (n≤10 animals/group) with ***P<0.001. D0, unexposed; D1, 1 day after light exposure; D4, 4 days after light exposure; D7, 7 days after light exposure. ‘a' indicates statistical significance (P<0.001) of light-exposed vs unexposed wild-type controls; ‘b' indicates statistical significance (P<0.001) of light-exposed vs unexposed Cln3Δex7/8 mice.
