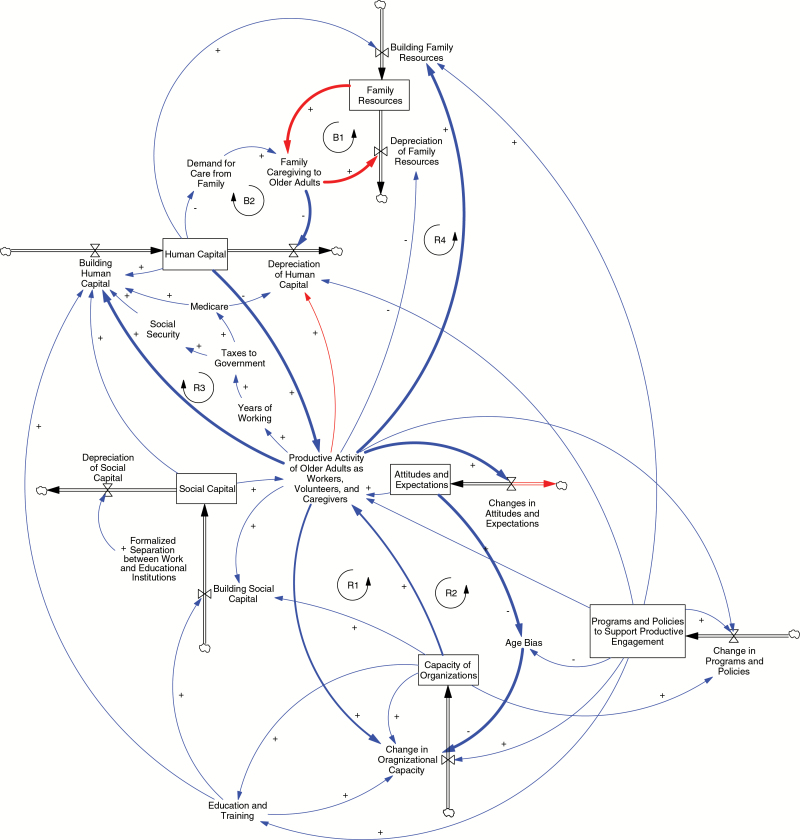
Figure 3.
Stock and flow diagram of productive engagement in later life. This diagram contains many feedback loops, from simple to complex, and all cannot be identified in a simple and clear fashion. R1, R2, R3, and R4 are examples of reinforcing feedback loops and B1 and B2 are examples of balancing feedback loops. Full descriptions of each can be found in Table 1.

