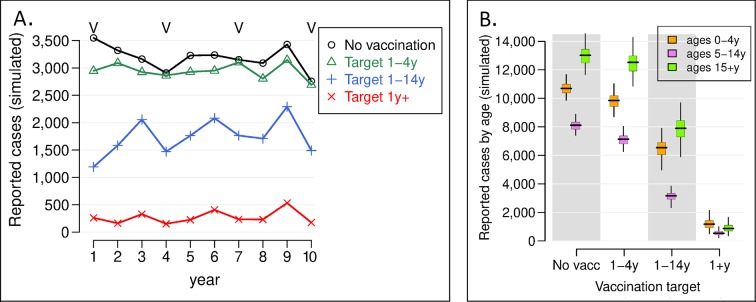
Fig 2. Predicted number of reported cholera cases in the targeted population (n = 1.4 million) following implementation of the vaccination program.
A) The simulated number of reported cases. Different target populations were targeted for vaccination in the model, and the average of 100 stochastic runs per strategy is plotted. The Vs above the lines indicate the years when vaccination campaigns occurred. B) The number of reported cases by age group when different age groups are targeted for vaccination. The boxes indicate the inter-quartile interval of 100 model runs, the horizontal lines the median result, and the vertical lines the 95% observed interval. Variation in model runs are a result of the stochastic nature of the model, not parameter uncertainty. *V indicates years OCV campaigns would take place.

