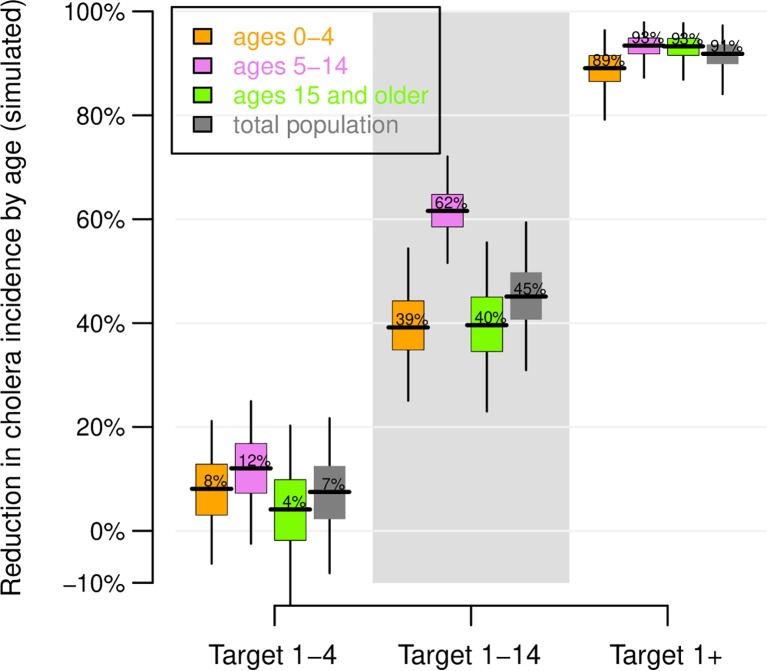
Fig 3. Predicted effectiveness of vaccination.
The percent reduction in cholera incidence by age group over 10 years with respect to simulations with no vaccination are plotted. The distribution of effectiveness estimates is computed by taking 10,000 random draws with replacement from 100 stochastic runs with vaccination and 100 stochastic runs with no vaccination. The boxes indicate the inter-quartile interval of 100 model runs, the horizontal lines the median result, and the vertical lines the 95% observed interval. Variation in model runs are a result of the stochastic nature of the model, not parameter uncertainty.

